Industry Insights Vol II, Issue 1
MarshBerry’s Perspectives for High Performance (PHP)
Insights from our proprietary financial database to help drive your business.
Employee Benefits Could Be the Key To Talent Retention
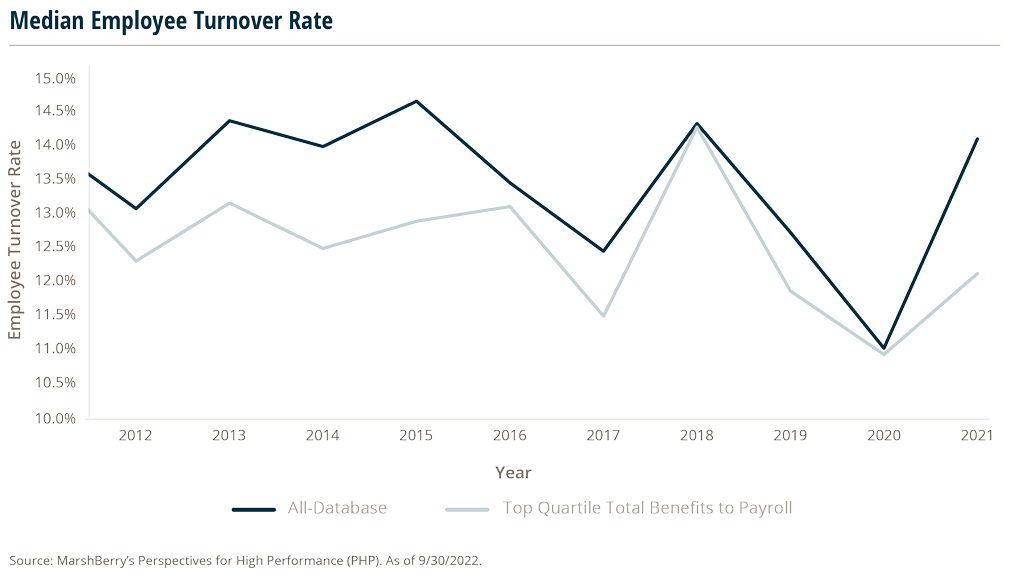
As the labor market tightens, it’s more important than ever to retain employees that are a good fit with an organization. Analysis of MarshBerry’s PHP shows that firms that are in the top quartile of total benefits to payroll each year consistently have lower employee turnover rates than other firms. In fact, over the past decade the median turnover rate for these firms has been better than the PHP database median every single year.
Here, “Total Benefits to Payroll” is defined as the amount of total benefits paid per dollar of payroll. “Employee Turnover Rate” is defined as the percentage of employees who leave the organization during a one-year period and includes both voluntary and involuntary separations.
It is important to note that some turnover can be healthy. So, while a high turnover rate can be undesirable, an unusually low rate can also signal potential problems.
Total benefits include expenses for retirement benefits, employee group insurance, payroll taxes, and other non-retirement benefits such as employee welfare, parties, gifts, etc. Employee group insurance tends to have the largest portion, averaging around 40% of total benefit expenses.
While overarching trends in the market impact the labor market for both top quartile firms and other firms equally, the difference in turnover between those firms is significant. Consider the value of your benefit packages as a method for competing for, and retaining, the best talent.
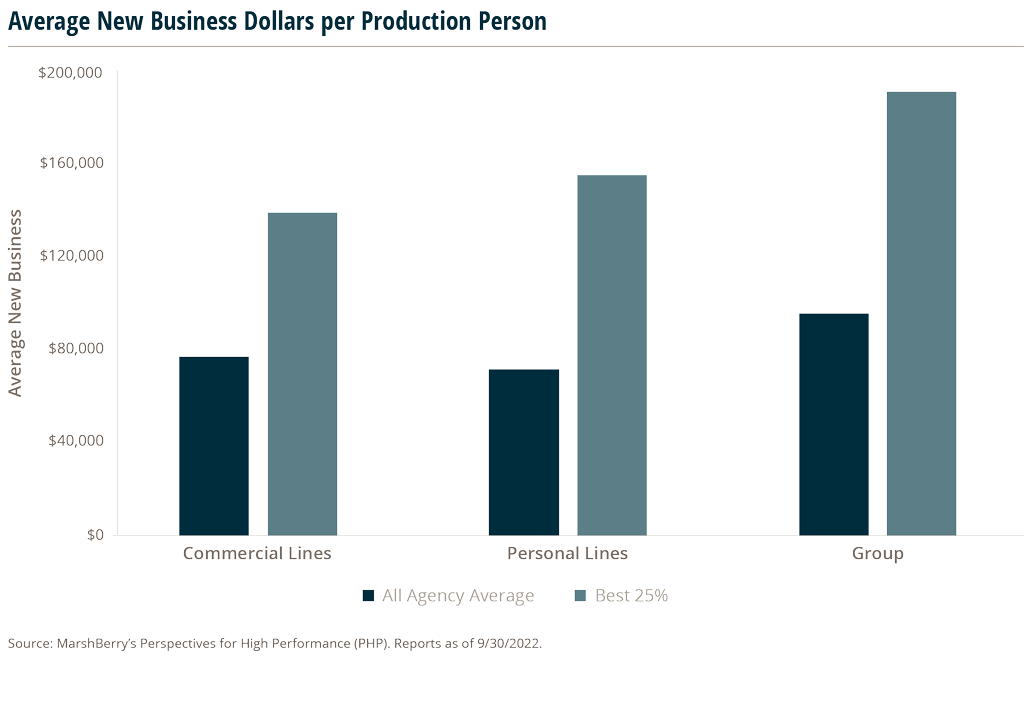
Impact of Service Staff On New Business Dollars
MarshBerry calculates New Business Dollars per Production Person as the total new business dollars in a given line of business divided by the number of related production personnel (measured in full time equivalents). The average across the industry was $77,400 per production person in Commercial Lines, $72,000 in Personal Lines, and $96,000 in Group.
Based on data from MarshBerry’s PHP, firms that achieve higher new business dollars per production person also tend to have a higher-than-average ratio of service-to-production personnel.
The industry average is two service full time employees (FTEs) for every production person in both Commercial Lines and Group and four service FTE’s for every production person in Personal Lines. Among firms that ranked in the top quartile for new business production per person (“Best 25%”), the average was 2.7 service FTEs for every production person in Commercial Lines and 3.5 FTEs for every production person in Group. In Personal Lines, this ratio was even higher, at 6.7 FTEs per production person. The converse is also true — firms that ranked in the bottom 25% also had a lower-than-average ratio of service to production personnel.