M&A Market Update October 2022
The Latest Deals and Insights
Who’s buying? Who’s selling? And why should you care? Phil Trem, MarshBerry’s President of Financial Advisory, highlights the current M&A market and provides a look at transactions in September 2022.
M&A Valuations Are Still Strong, But There Are Cracks in the Foundation
The fourth quarter begins amidst a turbulent year for the overall U.S. and global economies, where inflation, rising interest rates, and stock market volatility are dominating the financial news. However, merger & acquisition (M&A) activity in the insurance brokerage space continues to be highly active, with average valuation multiples seeing another increase through the third quarter.
As of September 30, 2022, there have been 405 announced M&A transactions in the U.S., a 23% decrease compared to this time last year. We anticipate that the rate at which deals are announced will increase in Q4 — ultimately shortening the gap between 2021 and 2022.
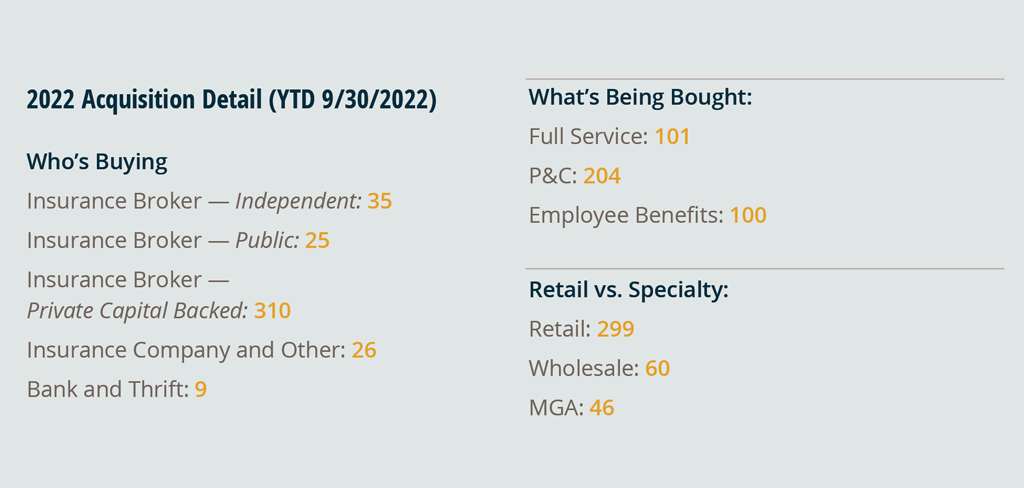
Private equity (PE) firms continue to be the dominant buyers and accounted for 310 (or 76.5%) of the total transactions through September. PE firms are displaying a capacity to continue buying at a steady pace and are eager to deploy available dry powder. The insurance distribution industry continues to be a highly sought-after investment as it appears the market is heading toward a prolonged period of economic stagnation.
Deals involving specialty distributors as targets currently account for 26% of the total deals year-to-date. This trend is anticipated to continue as traditional retail brokers expand into the wholesale and delegated authority space. Public brokers have remained consistent with last year in terms of total deal count, making up 6.2% of total announced transactions.
Digging into multiples
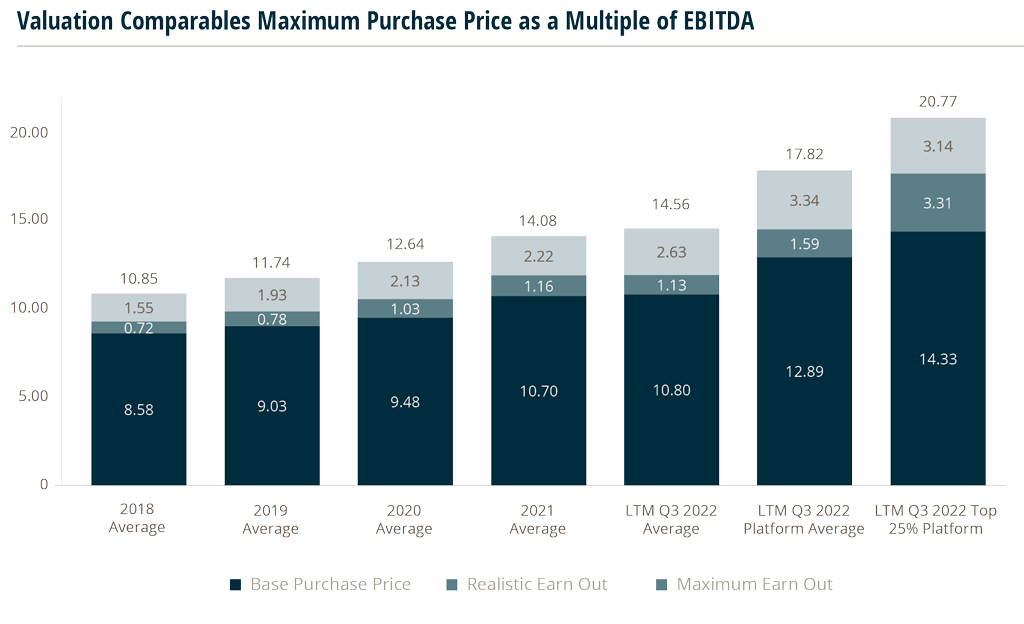
The average total potential deal value for the last twelve months (LTM) ending Q3 2022 is 14.56x Earnings Before Interest, Tax, Depreciation and Amortization (EBITDA). Comparing this figure to year end 2021, which produced an average total potential deal value of 14.08x EBITDA, maximum valuations saw an increase of 0.48x EBITDA in the last 12 months. This represents a 3.4% increase. Compare this to the prior period — where valuations saw a 1.44x EBITDA increase in 2021 (over 2020), representing an 11.4% increase.
While the average deal is topping out at 14.56x EBITDA, Platform deals in the last twelve months continue to push even higher. The average of the top 25% of Platform transactions are commanding close to 14.33x EBITDA on a Base Purchase Price with a maximum transaction value averaging 20x EBITDA. There are numerous additional deals slated to close in Q4 2022 that have valuations that are expected to top these trailing values.
Source: MarshBerry proprietary database.
Despite average transaction prices continuing to climb, there are some warning signs that perhaps the incredible run for M&A valuations might be showing some cracks. While many buyers remain well capitalized with dry powder raised prior to the Fed raising rates to stave off inflation, there are rumors that some buyers are staying out of the market because the cost of debt is too high. They are choosing to sit on the sidelines instead of borrowing at the new interest rates. Most have capital that will support them well into spring/early summer 2023 if they continue at their current pace of buying. However, a significant slow-down might be seen if markets don’t loosen up by the second quarter of 2023.
The rising cost of debt, and the eventual impact this might have on deal activity, cannot be ignored. Will valuations eventually flatten or drop? No one truly knows. The market seems to say “no.” But what’s being heard is “maybe.”
What is known is that demand continues to outpace supply and firms that show strong organic growth, leadership and offer unique or specialized services will continue to attract partners willing to pay a premium. So as valuations continue to rise, owners, and shareholders who are contemplating the future of their firms or their perpetuation plans may want to explore the market sooner rather than later.
Source: MarshBerry proprietary database. Data compiled from transactions in which we were directly involved, those from which we have detailed information, and transactions in the public record. Numbers may not add due to rounding. Past performance is not necessarily indicative of future results. Individual results may vary. EBITDA: Earnings Before Interest, Taxes, Depreciation, and Amortization; LTM: last twelve months; Q3: Quarter 3. Platform: High level transaction for a buyer, typically due to new geography niche, expertise, size, talent, etc. 10 Year Index: Multiple calculated based on deals closed from 1/1/2010 to 12/31/2019.
Notable Transactions in September
September 15
Partners Group acquired a controlling stake in Foundation Risk Partners (FRP). FRP’s management team maintained a stake in the firm while its previous PE sponsor, Warburg Pincus, will also retain a minority position. MarshBerry served as a financial advisor to FRP throughout the transaction.
September 28
One80 Intermediaries (One80), a Boston-based specialty insurance broker, announced its acquisition of C&M First Services (C&M). C&M is one of the largest Asian owned wholesale insurance agencies in the U.S. and specializes in providing innovative insurance solutions to Asian-American retail brokers. MarshBerry provided consultative services to One80 during this transaction.
October 3
Scottish American announced that it has acquired Hawkeye Wholesale Insurance Services, Inc. (Hawkeye). Hawkeye is a managing general agent and wholesale broker based in Washington. The firm has a niche focus in underwriting policies for habitational, contractors’ liability, and lessors’ risk. MarshBerry served as a financial advisor to Hawkeye throughout the transaction.
Source: S&P Global Market Intelligence, http://www.insurancejournal.com, http://www.businessinsurance.com/ and other publicly available sources. Disclosure: All deal count metrics are inclusive of completed deals with U.S. targets only. Scorecard year-to-date totals may change from month to month should an acquirer notify MarshBerry or the public of a prior acquisition. 2022 statistics are preliminary and may change in future publications. Please feel free to send any announcements to M&A@MarshBerry.com.