U.S. Macroeconomic Indicators Vol II, Issue 3
Market Trends and Current Statistics
Here are key U.S. macroeconomic indicators that are likely to impact brokerages within the insurance industry.
The Globalization Trend Of Insurance Distribution
The U.S. economy is becoming increasingly tied to the global economy. This is a trend that spans decades. In 1950, exports accounted for 2.8% of U.S. real GDP while imports represented 3.7%. By the end of 2022, exports reached 12.8% of real GDP in the U.S. while imports account for 19% of real GDP. Durable and nondurable goods represented the majority of what was imported and exported.
However, trade in goods and services is only one indicator of rising globalization. Direct investment by U.S. businesses in other countries has also risen substantially, as has foreign investment in the U.S. In 2021, U.S. investment abroad reached nearly $6.5 trillion, up from over $1.3 trillion in 2000 while foreign investment in the U.S. was just short of $5 trillion, from just short of $1.3 trillion in 2000.1
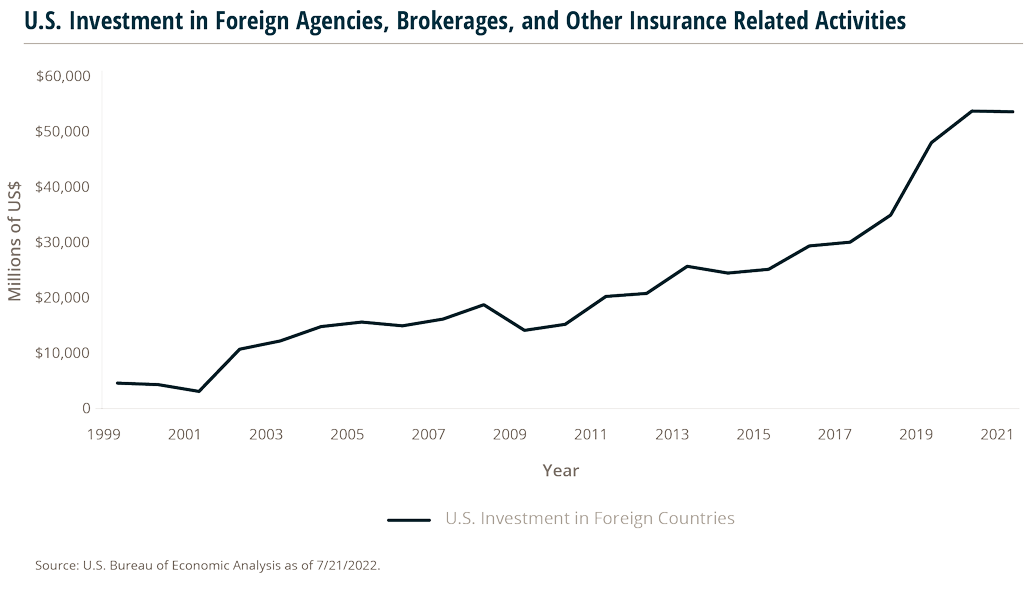
Investment in insurance agencies and brokerages has not been exempt from this globalization trend – despite varying laws surrounding the sale of insurance around the world.
U.S. investment in insurance businesses abroad rose from $3.8 billion in 2000 to $53 billion in 2021, representing a compounded annual growth rate of 13.3%.
This is faster than the 7.9% growth in overall U.S. investment in foreign businesses during the same period.
Foreign investment in U.S. insurance agencies and brokerages has also grown over the past several decades, though not as rapidly as U.S. investment abroad. In 2021, foreign investment registered at $13 billion, an increase from $6.5 billion in 2000.
In 2021, the countries that received the most U.S. investment in finance and insurance businesses were the United Kingdom, Canada, Netherlands, Japan, and Luxembourg. The European Union, when considered as one entity, represents the largest foreign investor in U.S. finance and insurance businesses. Considering individual countries, Japan is the largest investor in this U.S. business sector, with Canada in second. The Netherlands and Germany are not only the largest European investors in U.S. finance and insurance businesses, but also the third and fourth largest investors individually.
Remote Work Policies Shifting In 2023 With Economic Change
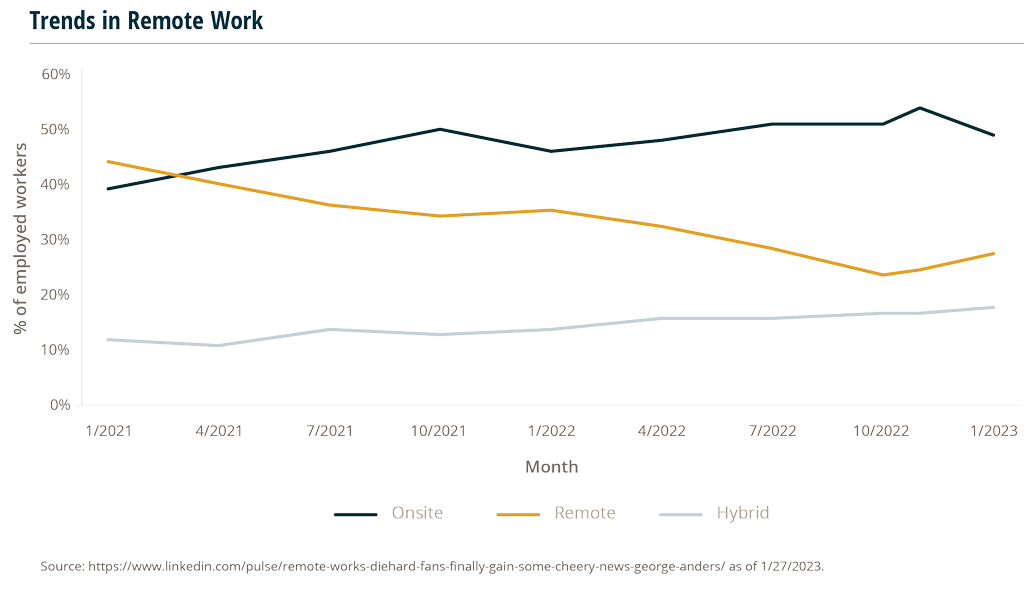
Return to office, for at least part of the week, is increasing in the post-pandemic workplace. USAA recently called remote workers back to the office—including those hired for 100% remote positions. Other major corporations pulling back on workplace flexibility in some form include Disney, Starbucks, and Tesla. Lloyd’s of London’s chief executive, John Neal, recently made headlines when he expressed frustration at the lack of employees in the office on Mondays.
That doesn’t mean remote work is disappearing. There are expected to be 36.2 million American employees working remotely by 2025.2 Microsoft, SAP, and Johnson & Johnson are just a few of the organizations still offering completely remote roles.3 Some companies are even switching permanently to a remote work environment. Allstate has strongly embraced work-from-home, with almost 85% of their staff telecommuting.4 The insurance industry specifically cites the competition for talent, a need for diversity, and digital solutions as core reasons to keep remote work as an option.5
While return to office is making headlines, it’s not widespread—yet.
There are findings that major companies recalling workers represent the exception, not the rule. Some businesses fear turnover or threats of unionization if they push for in-office work. Others are calling their return to office policies “experiments” with the potential to add flexibility in the future.
A recession, which is likely for 2023, will impact working styles in some way. Corporations may feel more comfortable directing employees to come into the office if unemployment goes up. Other companies may take the opposite stance due to the decreased costs of having remote employees. Reducing expenses like office space, furniture, utilities, and building maintenance would be a welcome benefit in the event of a recession.
There’s more to the “where do you work” discussion than just remote vs. office. Varying hybrid options are becoming the norm – requiring certain days in the office and the rest at employee discretion. A four-day work week study in the U.K. proved successful and some U.S. candidates want a four-day work week to be law.
Expect more changes and reversals as companies navigate economic change, worker backlash or turnover, and the overall state of the labor market landscape.
Is The Housing Market Bubble About To Burst Or Just Coming Back Down To Earth?
The definition of a housing market bubble is when there is high demand and inflated property values. The bubble can burst and come crashing down because of macroeconomic factors such as rising interest rates, a slowing economy, and/or higher unemployment – resulting in declining demand for homes and dropping prices. Very few people benefit from a housing market crash, despite the idea that some buyers may be able to buy homes at significant discounts.
The last time the housing market bubble burst (in 2008), it created a banking financial crisis which triggered the Great Recession.
The current housing market with soaring real estate prices, high mortgages and a (previously) hot, COVID-induced sales market (but turning cold over the past 12 months) – reeks of a bubble about to burst. Combine this with Silicon Valley Bank (SVB) and other bank collapses and there’s a déjà vu moment reminiscent of the Lehman Brothers collapse in 2008.
Differences between the 2023 and 2008 housing markets
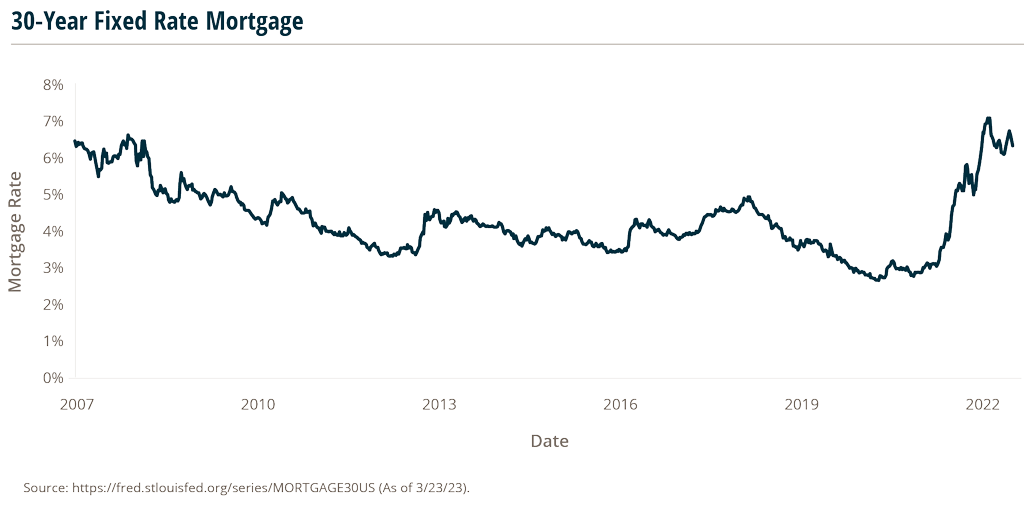
Today’s housing market certainly is similar to that of 2008 as people purchase homes at historically high prices. In 2008, peak buyers experienced an overnight plunge in property values making their loans higher than the value of their property, leading to massive foreclosure rates. What compounded the troubles for the housing market back then was an inventory glut of new homes for sale, high mortgage rates with risky subprime lending practices, and high unemployment.
Today, while average home prices are at historical highs, with 30-year fixed mortgages at their highest since 2002, there are significant differences between this housing market and the 2008 housing crisis.
For starters, the U.S. is experiencing an unprecedented strong labor market, with unemployment at historic lows, and rising wages. So, today’s home buyers are better able to afford high-rate mortgages and over-priced homes.
Next, while the current 30-year fixed mortgage rates are higher than they were in 2007-2009, today’s better lending practices and credit standards limit the number of subprime loans written and the level of foreclosure risk.
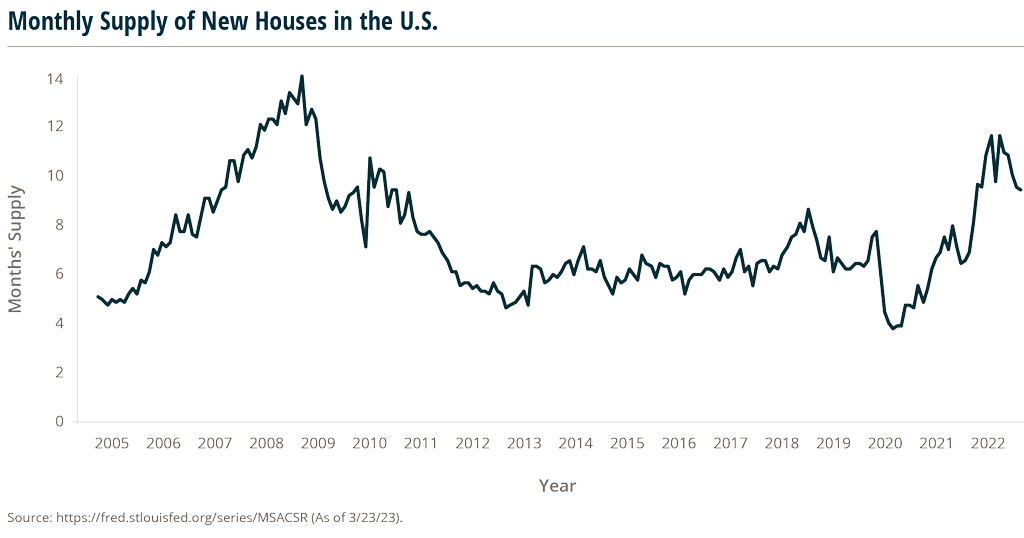
Lastly, the supply of housing in 2023 is the opposite of 2008. Currently, the U.S. has a shortage of new and existing homes for sale. In February, there were 980K existing homes on the market. That is up 15.3% year-over-year (YoY), but down 24.6% from an inventory high in July 2022.6 At the current rate of home sales, the number of available existing homes would be exhausted within 2.5 months – well below the preferred healthy supply of 4-7 months.7
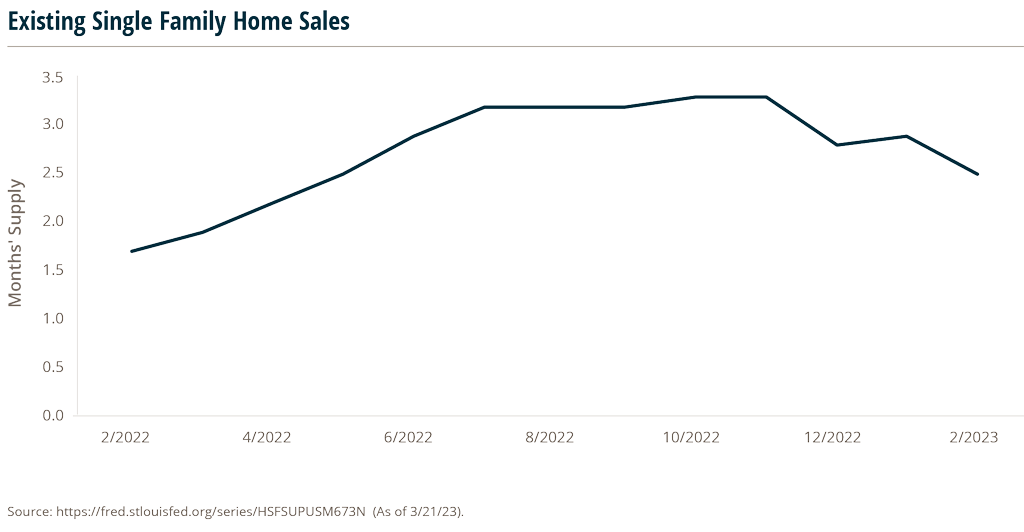
New home inventory in February reached 436K new homes, also up year-over-year by 10%, but down 6% from an inventory high in October 2022.8 In 2008, there was a new home construction boom and by January of 2009 there was a surplus of new homes on the market, reaching 12.2 months’ oversupply.9
Home sales start to creep up as mortgage rates and housing prices drop
The concern is that two opposite forces are playing a game of chicken, creating a tension that could spark a “crash” – high real estate prices and buyers sitting on the sidelines. The recent bank collapses are creating concerns about tighter lending standards and mortgage approvals, adding to the stress.
However, existing home sales rose in February for the first time in 12 months, up 14.5% over January, reaching a volume of 4.58M homes, the highest volume since September 2022.10 A slight drop in mortgage rates in early February to almost 6% (down from a high of over 7% in November), compounded by the first year-over-year drop since 2012 in median existing home prices by 0.2%6 – may have been the first “flinch” to keep the housing market in check.
Sources:
1 https://www.bea.gov/news/2022/direct-investment–country-and-industry-2021
2 https://www.zippia.com/advice/remote-work-statistics/
3 https://www.indeed.com/career-advice/finding-a-job/best-remote-work-companies
7 https://fred.stlouisfed.org/series/HSFSUPUSM673N
8 https://fred.stlouisfed.org/series/HNFSEPUSSA
9 https://fred.stlouisfed.org/series/MSACSR
10 https://www.wsj.com/articles/home-prices-fell-in-february-for-first-time-in-11-years-73df0107