U.S. Macroeconomic Indicators September 2022
Market Trends and Current Statistics
Key U.S. macroeconomic indicators that are likely to impact brokerages within the insurance industry.
The Federal Reserve Maintains Its Stance On Fighting Record High Inflation
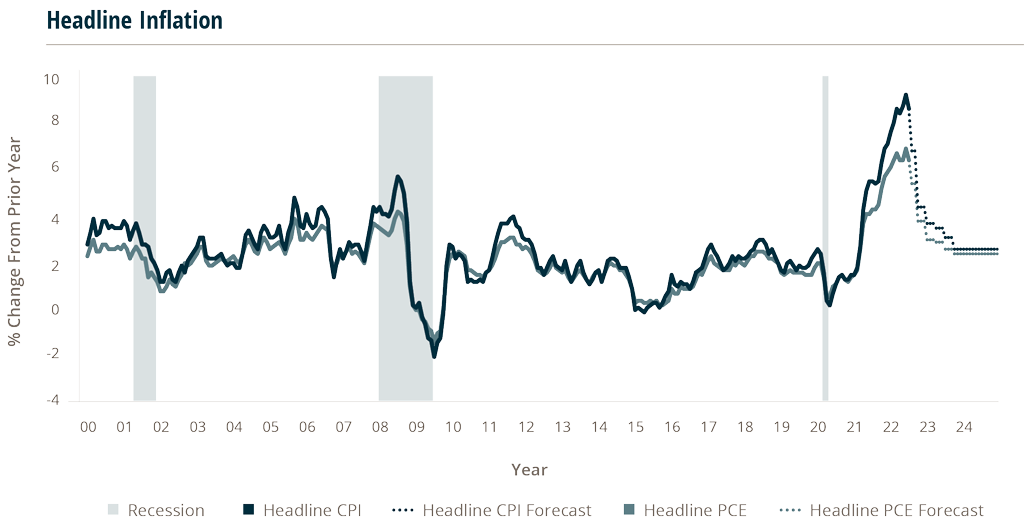
In 2022, inflation has been registering at levels last seen two decades ago, with the Consumer Price Index (CPI) rising as high as 9.1% and the Personal Consumption Expenditures (PCE) price index is at 6.8%. In response to this, the Federal Reserve (Fed) has been raising the Federal Funds effective rate (Fed Funds rate) and shrinking its balance sheet. The Fed Funds rate started 2022 near zero, but the Fed began raising rates in March and has continued to do so, and in its June publication the median projected Fed Funds rate for the end of 2022 was 3.4%. Food and energy prices are volatile and are often excluded from calculations when looking at long-term inflation trends. Excluding food and energy, core inflation has been a little softer for both CPI and PCE in 2022, peaking at 6.4% for CPI and 5.2% for PCE in the first quarter of the year.
Looking ahead, the Federal Reserve Bank of Philadelphia’s Survey of Professional Forecasters’ median inflation projections from their Q3 report in August have CPI slowing to 4.3% and PCE to 3.7% by Q4. They also project the annual average for 2023 as 3.2% for CPI and 2.8% for PCE. For core inflation, median projections for Q4 are 4.6% for CPI and 3.5% for PCE. These are increases from May’s Q2 survey despite the strong actions the Fed has taken in the months between.
4.6%
CPI Median Projections for Q4
3.5%
PCE Median Projections for Q4
Despite some signs that inflation may be beginning to slow, Fed officials have continued to state their position for maintaining rate hikes until they feel inflation is completely under control.
Source: Federal Reserve Bank of St. Louis, August 25, 2022.
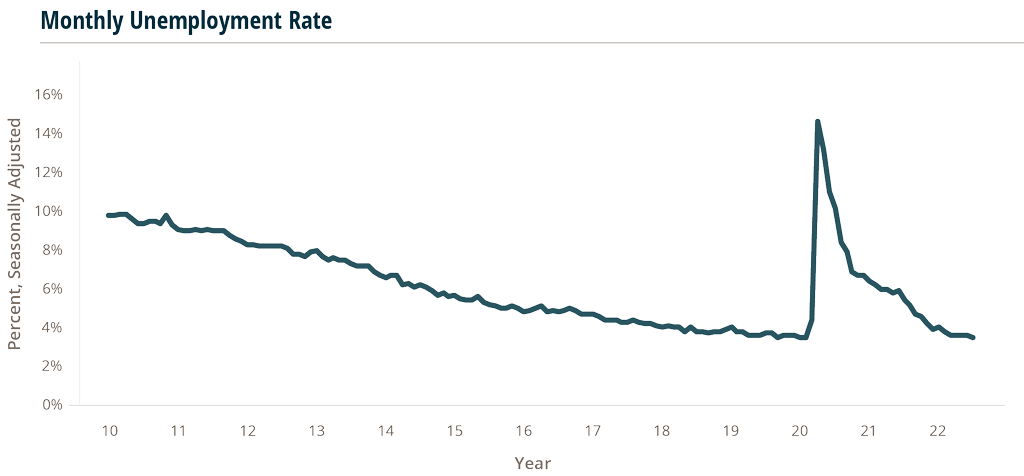
Will Lowering Inflation Require Higher Unemployment?
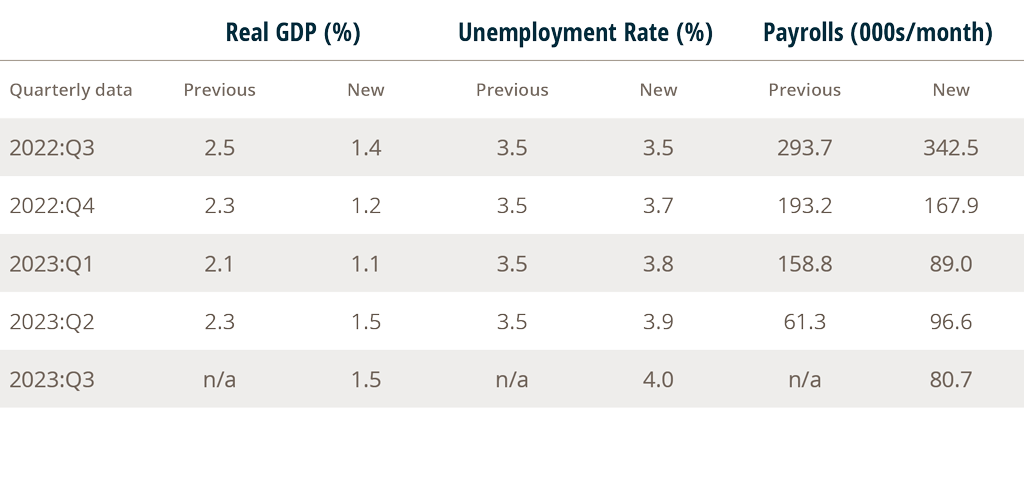
The Federal Reserve Bank of Philadelphia conducted a survey amongst 35 forecasters, and the consensus is the U.S. economy looks weaker now than it did three months ago, but unemployment data has held relatively steady. Although the unemployment rate has steadily declined over the last 28 months to pre-COVID-19 levels (registering at 3.5% in July), forecasters now believe it could reach 4.0% by Q3 2023. The previous survey forecasted unemployment staying at 3.5% from 3Q2022 to 2Q2023, but the new survey shows unemployment increasing by ten basis points each quarter to reach 4.0% in 3Q2023.
While steady, low unemployment is positive for U.S. workers, the Fed has recently implied that unemployment may need to rise much higher to combat inflation and for it to slow down the increases of the Fed Funds rate.
On August 26, Chair of the Fed, Jerome Powell, stated at the annual Jackson Hole Economic Symposium, hosted by the Federal Reserve Bank of Kansas City, that the Fed will try to bring down inflation to 2% but that will have an impact on jobs and economic growth. Powell stated, “There will very likely be some softening of labor market conditions. While higher interest rates, slower growth, and softer labor market conditions will bring down inflation, they will also bring some pain to households and businesses.” He also mentioned that the Fed will “use tools forcefully” to manage inflation, as Powell noted that the economy “continues to show strong underlying momentum,” despite mixed metrics, including contracting Gross Domestic Product (GDP) growth. The Fed raised their benchmark Fed Funds rate by 0.75 percentage points at each of their last two meetings to a range between 2.25% and 2.5%. This is the most rapid increase in short-term interest rates since the central bank began using the Fed Funds rate as its target in the early 90s.
Source: U.S. Bureau of Labor Statistics https://www.bls.gov/
Sources: U.S. Bureau of Labor Statistics, 7/2022. https://data.bls.gov/timeseries/LNS14000000; and Fed Philly: https://www.philadelphiafed.org/surveys-and-data/real-time-data-research/spf-q3-2022
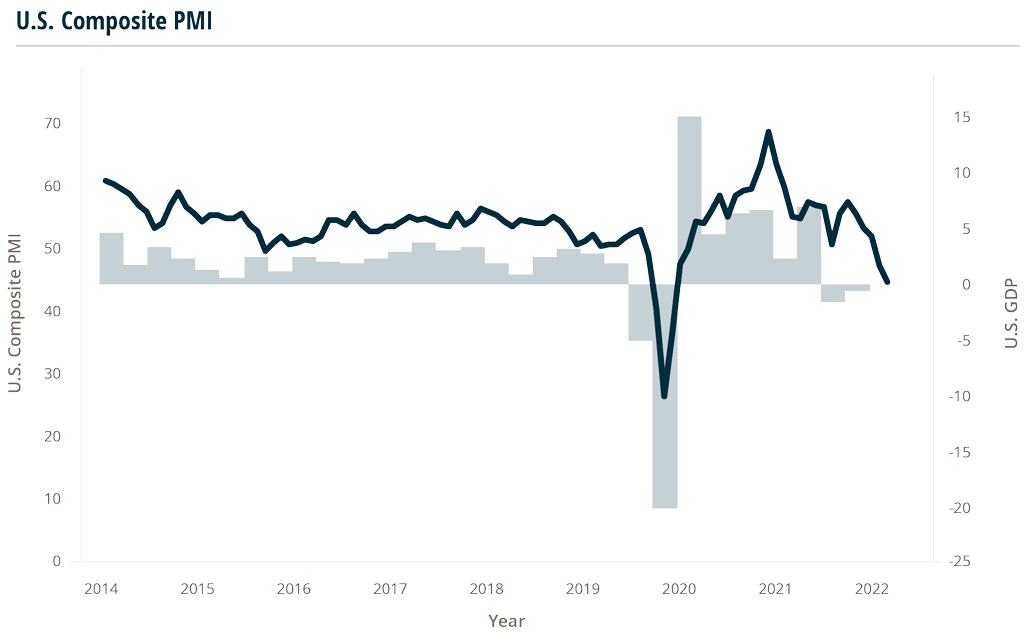
Purchasing Managers Index (PMI) Points Toward A Slowdown In Consumer Spending
U.S. business activity, as measured by the Purchasing Managers Output Index (PMI), contracted for a second straight month in August, reflecting softer demand at both manufacturers and service providers. The PMI registered 45 in August, down from 47.7 in July, which is the fastest decline seen since May 2020. Ignoring the early months of the pandemic, the August figure is the weakest since 2009 with readings below 50 indicating contraction.
Customer demand was dampened by material shortages, delivery delays, interest rate hikes, and strong inflationary pressures. Businesses reported a decline in new orders which points to weakness in the months to come while factories reported a build-up in inventories as goods remained unsold. The increase in inventory suggests improvements in manufacturing production in the short-term are unlikely.
Globally, the economic outlook also appears to be weakening. Output in the eurozone dropped for a second month amid record energy and food inflation. The PMI for Germany and France pointed to the sharpest declines in business activity since the first wave of the pandemic. Business activity also contracted in both Japan and Australia.
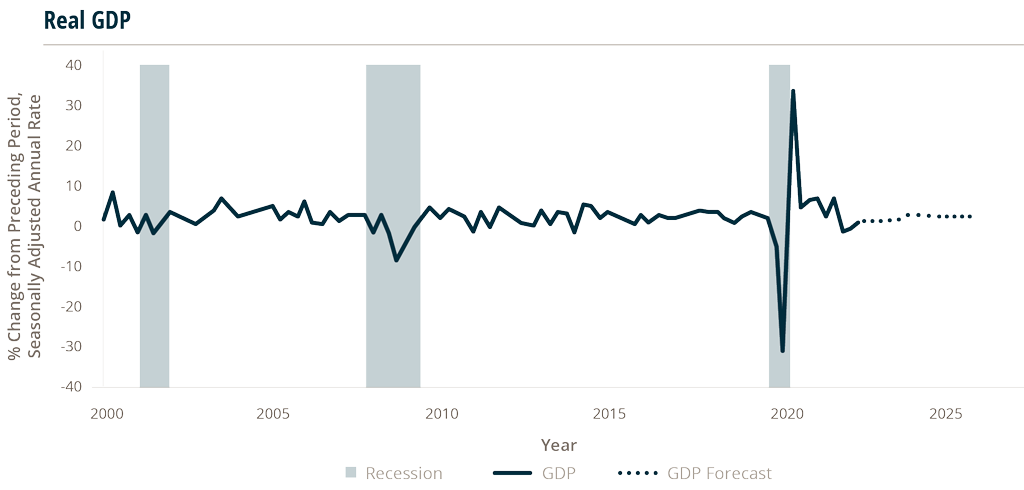
What Exactly Does A Recession Look Like?
GDP posted seasonally adjusted annual declines in the first two quarters of 2022 prompting announcements of a technical recession. Economic recessions are identified by the National Bureau of Economic Research (NBER) which takes several economic indicators, including GDP, into account when determining peaks and troughs of economic activity.
Although there have been two quarters of GDP decline in the U.S., there has been some opposing data that’s leading economists and analysts to question whether the country is currently in a recession.
In fact, not all recessions have included two consecutive quarters of GDP declines. The recession of 2001 was the most recent example of this where GDP only declined in the third quarter of that year. That recession did however have a noticeable drop in industrial production, real personal income, and employment, which are a few of the other indicators the NBER uses to determine business cycle dates.
So, what is happening in the current business cycle? So far this year real manufacturing and trade industries sales have dipped along with GDP. However, employment, personal income, consumer spending and industrial production are all higher than 2021 levels. While this seems to signal that there may not be a recession, it could simply mean that real manufacturing and trade industries sales and GDP were the first movers for a downward cycle and the other indicators will follow in time.
Keep in mind, there is no absolute formula for a recession and no two recessions are exactly alike. For instance, in the 1973-1975 recession it took roughly a year into the recession period before employment levels dropped below pre-recession levels. Additionally, the last time the U.S. experienced annualized GDP declines in two consecutive quarters and it was not deemed to be a recession was in 1947, the first year quarterly GDP data was collected.