Focused Insights: Driving Shareholder Value Through Producer Compensation Gearing December 2022
“Producer Compensation Gearing” as part of strategic planning can drive shareholder value as it aligns growth, profit, value proposition and talent acquisition.
One of the most common questions asked of a consultant or investment banker at MarshBerry is, “What is the right producer commission split?” The answer may surprise you — “We have no idea.” Why? Because it depends upon your desired growth rate, value proposition, the cost of your base operations, your preferred business model and to what extent you want to drive shareholder value. If the answers to those questions are known, we can utilize what we call “producer compensation gearing” to create the optimal producer compensation plan — and at the same time, drive shareholder value.
Most insurance agents and brokers have an insatiable desire to attract and retain talent, especially in the production ranks. As a result, firms often look to what is “average” or “competitive” in the local market. Pegging your producer compensation rate to what is “average” or “competitive” is a fool’s errand. Most of your peers are loaded with non-producing producers, are overcompensating producers, have inferior profit, are not growing at a rate that exceeds rate changes and have no hope of perpetuating ownership. Their inferior producer compensation plan will be the final nail in the coffin of their sustainability. To attract and retain talent while driving growth and profitability, insurance agencies and brokers should gear producer compensation as part of a larger plan to drive value. As the largest and most important expense on the profit and loss (P&L) statement, the right producer compensation plan is critical. Unfortunately, very few have it right.
A well-designed producer compensation plan has a tremendous impact on growth, talent acquisition, perpetuation, sales culture, value creation and the performance of the business — especially during turbulent times.
There is no one-size-fits-all approach or secret formula to determine the best producer compensation plan. But by using a strategy of compensation gearing — there is a way to look at how producer compensation fits into your desired business model and how you plan for growth and profitability.
Producer compensation gearing is the recipe to build a blueprint for success
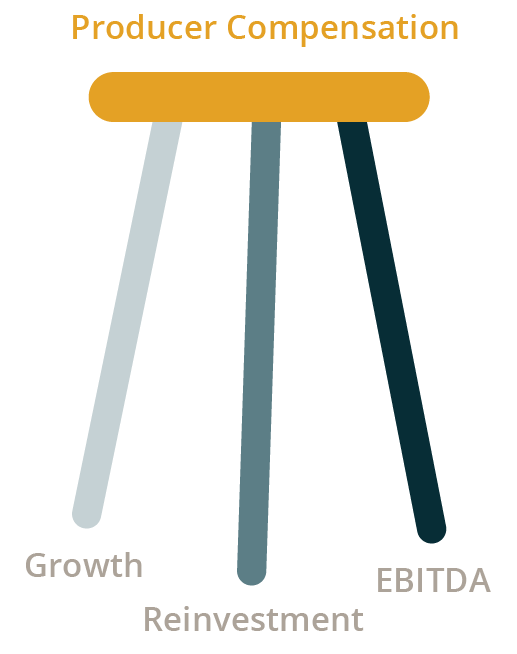
Producer compensation gearing is like a 3-legged stool. The three legs of the stool — growth, reinvestment, and EBITDA1 need to be firmly set or the stool will fall over. Producer compensation is what’s left after these considerations, or the “plug.” The optimal producer commission split should be dependent upon how well you balance your goals for growth, reinvestment and EBITDA.
As you develop your blueprint for the future, you first need to decide what is the desired growth rate for your firm? Do you want to be a slow growth business? Or do you want to be a moderate growth business? Perhaps you aspire to be a high growth, a super growth, or even a hyper growth business. Making that decision first is critical as all other decisions should cascade from that goal. The selected growth target determines the EBITDA margin you should strive to achieve. This table illustrates the optimal relationship between growth and EBITDA, based on MarshBerry’s proprietary database of more than 1,000+ firms, and experience in the industry. Managing the correlation through producer compensation gearing is the recipe to build a blueprint for success.
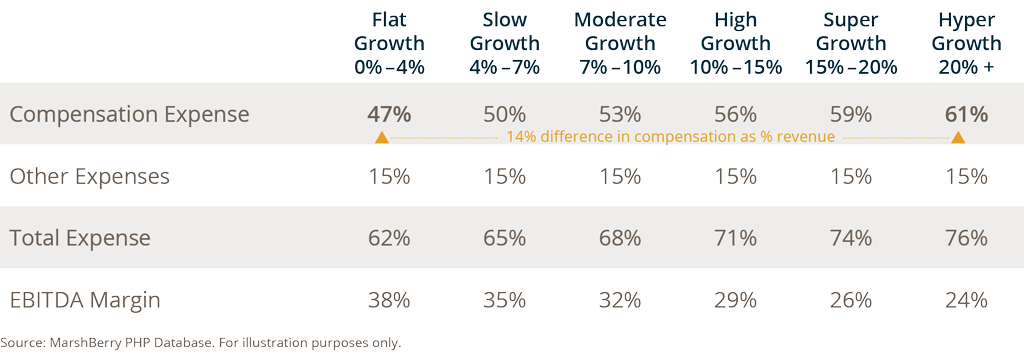
After growth and EBITDA targets have been identified, the next step is to work up the P&L statement, or work up from the margin and analyze the various categories of expenses. Assume for example that your desire is to be a moderate growth business. The optimal EBITDA margin for an 8% growth business is 32%. With the margin fixed at 32%, as you work up the P&L from the margin and review each individual expense, it becomes clear which expenses are optional and which expenses are not.
The reinvestment rate in new production talent should be managed by setting a target for Net Unvalidated Producer Payroll (NUPP).2 The NUPP target should be a byproduct of achieving long-term sustainability, as measured by weighted average producer age (total book)3 and weighted average producer age (new business).4 Simply stated, the reinvestment rate should be set to manage and maintain a desirable average age within your production ranks as measured by both new and renewal business. The desired average age must balance fresh blood, future book handling capacity and long-term new business potential with wisdom, experience, and technical expertise to achieve long-term sustainability.
Your cost infrastructure is based primarily upon two items, base operations and value proposition. Base operations are largely non-optional and represent what is necessary for any insurance operation to exist (i.e., operating expenses, selling expenses, accounting, the agency management system, client service advisors, management, placement, etc.).
Your value proposition, however, is different. Value proposition is optional. It is based on the type of organization shareholders want and the differentiated solutions curated to achieve that outcome. These investments are made largely in human capital and are designed to enhance new business and retention, all of which directly benefit the production staff. Value proposition can be seemingly infinite in the arms race for differentiation (i.e., technology, data analytics, safety, loss control, nurse case management, portals, alternative risk, HR consulting, account executive staff, practice leadership, claims advocacy, compliance, written service timelines, professional liability, prescription drug management, wellness, human resources, voluntary benefits, etc.). The extensiveness of the value proposition is optional but is borne off the type of organization that shareholders want to build and the investments that are necessary to achieve that outcome.
After committing to producer reinvestment, base operations and value proposition, the only expenses left are producer compensation and executive compensation. Provided that executive compensation is set as if the business was owned by a third-party (no excess owner payroll), the only variable left is producer compensation. This is the “plug.” Producers may take offense to being considered the plug. However, the expenses related to the value proposition exist almost entirely to support the producers’ ability to win and retain business. The producers are the beneficiaries, not the victims, of the investment in the value proposition.
If the resulting commission split is perceived to be too low, the first reaction may be that the value proposition is either too expensive or too extensive. But what is more typical is that leadership has done a poor job of understanding or explaining why a lower split is in fact better for the producers. That is when the magic happens. Instead of being part of the arms race and investing in every bell and whistle producers “need” while draining margin, leadership must revisit the value proposition and optimize it with margin and producer compensation. Most firms that are growing and are in the thick of the arms race rationalize a deficient margin instead of solving the problem.
Higher growth or higher margin?
So, the ultimate decision is — would you rather have a higher growth company with a lower margin or a slower growth company with a higher margin? Pick your poison, so to speak.
If the desire is to own an income stock versus a growth stock, flat growth should produce a total compensation expense of around 47%. Assuming 15% in all other expenses, total expenses would be 62% of revenue and the EBITDA margin would be 38%. While 38% should be the EBITDA target for a no-growth agency or broker, in practice, it is difficult to achieve because it requires running the business well (optimal producer compensation, expense control, healthy select unit thresholds, dealing with non-producing producers, etc.). Dramatic changes to unlock margin happen all the time in a sale but shareholders seldom have the fortitude to make those same requisite changes when independent or to enable perpetuation. And, if a firm had strong enough leadership to manage expenses that well, that same leadership would perhaps figure out how to grow. Some low growth firms have figured it out and today remain independent. But most of them are suffering a slow demise given limited career opportunities, an uninspiring culture and the resulting inability to attract and retain talent.
By contrast, if shareholders desire to have a hyper growth business, their investments in new producers and colleagues to drive a superior value proposition need to be much higher — and it is expensive. To make the math work, such a platform requires much lower producer compensation splits while at the same time significant investments that, in total, increase total compensation by as much as 14%.
People often question the dichotomy of a lower producer commission split while enhancing the ability to attract and retain production talent. The answer is simple. Reinforce the dollar sign, not the percentage sign. Higher new business production and retention through a robust value proposition creates much larger books of business and higher W2 income. You cannot spend or save a percentage, but you can spend or save a dollar.
It’s a rhetorical question, but would a producer rather make more money with a bigger book at a smaller percentage or less money with a smaller book and a higher percentage?
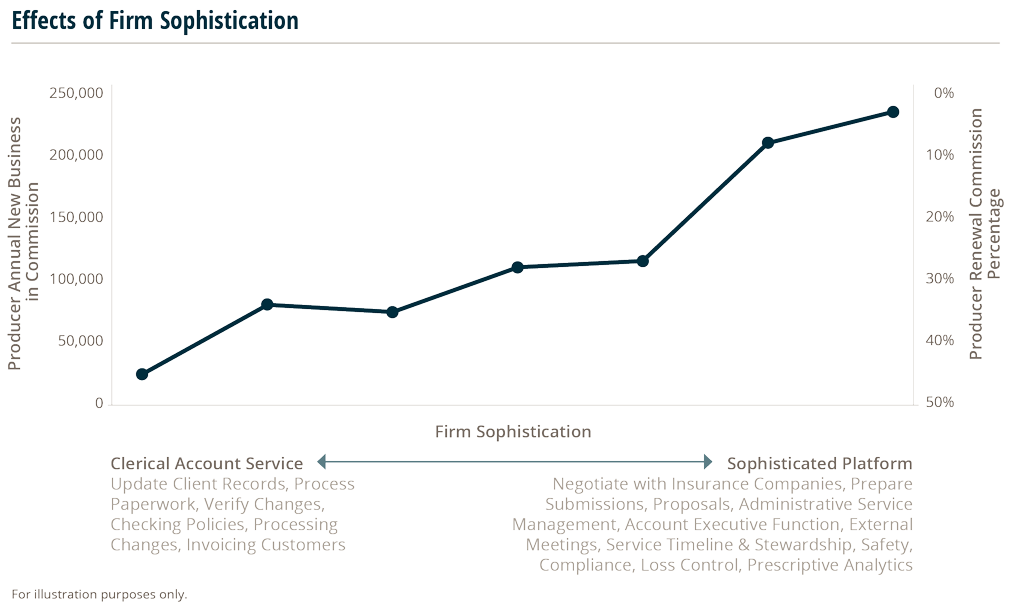
To make it even more complicated, the reality is that producer commission splits are very fungible. For example, many larger brokers with deep resources parse out the renewal rate based on function. A larger broker might pay a 25% commission on renewal, but that split may be allocated based on who originated the account (6.25% renewal commission rate or RCR), who manages high-level relationship (6.25% RCR), what industry vertical specialist placed the account (6.25% RCR) and who handles the account on a day-to-day basis (6.25% RCR). A producer that originates an account and manages the high-level relationship but relies on an account executive as well as an industry vertical practice leader to place the account — may only receive 12.5% on renewal. The more extensive the platform, the lower the net split.
A simpler way to think about it is that a more sophisticated service platform produces higher new business, and larger renewal books, at a lower renewal split. Whereas a more clerical platform pays a higher renewal split but with inferior new business results.
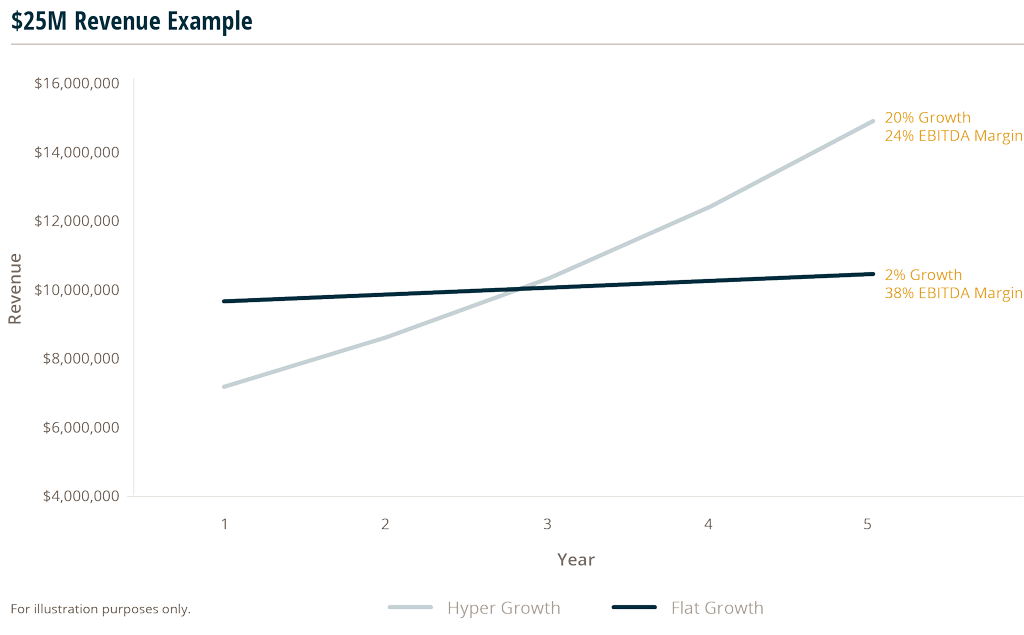
While few choose to espouse hyper growth, faster growth in general enhances shareholder value, even at lower EBITDA. The EBITDA generated may be lower in the early years, but it does not take long for EBITDA at faster growth to eclipse EBITDA at slower growth. For example, look at a $25M revenue firm and the difference between 2% and 20% growth trajectory. The crossover occurs around year three. Each year after, the faster growing firm generates greater shareholder value given greater cash flow. And a high growth business that is run with the right culture has the special something, that spark, that gravitational pull that feeds upon itself, creating palpable momentum in attracting talent and new business.
Taking a hard look at your compensation strategy
It is quite common for firms that are growing to rationalize a deficient margin — when in fact, producer compensation needs to be reengineered.
Producer compensation strategy and changes to producer commission splits are not for the faint of heart. But the best firms in the industry have attacked this challenge and at the same time have built a culture that embraces change, no matter how difficult and uncomfortable it can be. And these firms can attract and retain talent, drive shareholder value and remain in control of their future as opposed to having the external world determine their fate.
It’s not a matter of “if” this change to producer compensation will occur, it’s about “when” it will occur. If you don’t do it for yourself, you will eventually be forced to do so — to be marketable to buyers.
- EBITDA: Earnings Before Interest, Taxes, Depreciation & Amortization
- Net Unvalidated Producer Payroll (NUPP): The sum of total compensation for all unvalidated producers this year less “validated” compensation this year divided by net revenue this year.
- Weighted Average Producer Age (Total Book): The sum of each producer’s share of the firm’s TOTAL book of business multiplied by the producer’s age.
- Weighted Average Producer Age (New Business): The sum of each producer’s share of the firm’s total NEW business multiplied by the producer’s age.
Footnotes 1-4 describe four of the more than 1,000 ratios and metrics calculated quarterly for subscribers to the MarshBerry Value Intelligence Portal. The MarshBerry Value Intelligence Portal is the industry’s leading interactive analytics portal and performance benchmark engine for insurance agencies and brokers in the insurance industry. Quarterly ratios of participating firms are compared to peers of similar size and type.