U.S. Macroeconomic Indicators April 2022
In this Section
Market Trends and Current Statistics
Key U.S. macroeconomic indicators that are likely to impact firms within the insurance industry.
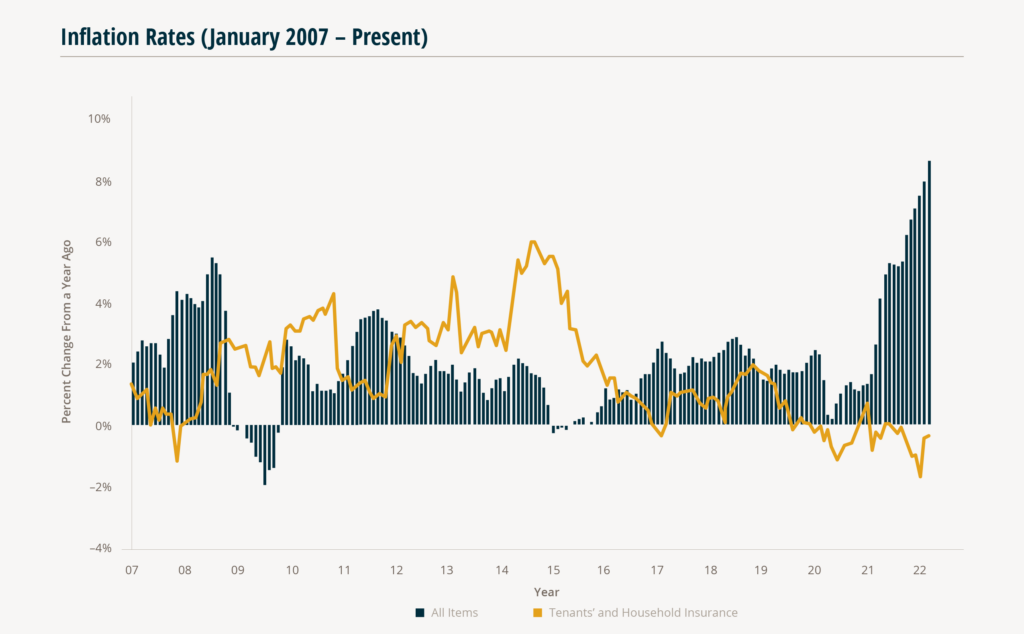
Inflation Rates
Based on the Bureau of Labor Statistics data, total U.S. inflation, as measured by the Consumer Price Index (CPI), rose 8.5% in March from a year ago, marking the largest increase since 1981. Rising prices are likely due to pandemic–related supply chain issues, monetary policy, geopolitical tensions, and a tight labor market. Furthermore, some analysts see inflation remaining far above the Fed’s long–term target level (~2%).
Higher than anticipated inflation could threaten reserve levels and underwriting profitability for the insurance industry. The early– to mid–1980s is an example of an extended high inflationary period, with CPI increases peaking at 14.6% in March 1980. Subsequently, the industry recorded well above 100% combined ratios, indicating underwriting losses.
8.5%
Consumer Price Index
March 2022
Four factors could act as a headwind to inflation. The projected slower economic growth after this year could result in less inflation. The Fed has already become more hawkish and began rate hikes in March 2022. However, the future of energy prices is unknown, and commodity prices are expected to continue moving higher.
14.6%
CPI Peaking in 1980
Overall, insurers and brokers should prepare for a continued period of elevated inflation while keeping an eye on economic data that influences the Fed. Claims costs for P&C insurers could exceed reserves if established with much lower inflation assumptions. However, industry reserves are in a stronger position than in the 1970s. Furthermore, the tighter job market could continue for months, as changes in the unemployment rate typically lag inflation and GDP growth.
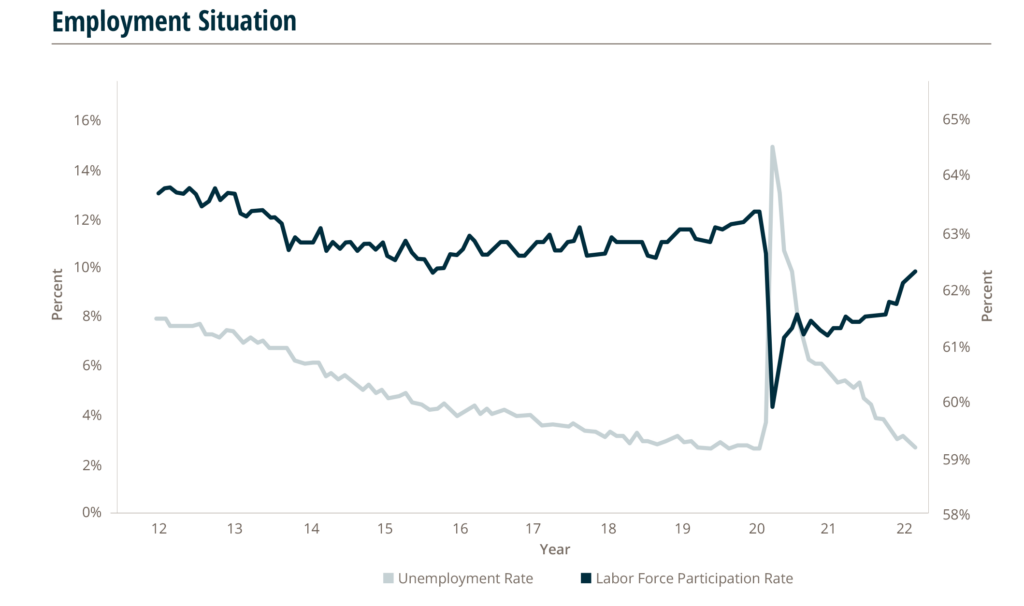
Employment Situation
The unemployment rate registered at a seasonally adjusted 3.6% in March, the lowest point since February 2020’s pre–pandemic levels. In 3Q2021, the Federal Reserve Bank of Philadelphia’s Survey of Professional Forecasters estimated the natural unemployment rate stood at 3.78%, which means unemployment has potentially approached its equilibrium point.
The labor force participation rate — the share of the working–age population who are either employed or actively looking for a job — continued to climb to 62.4% in March. This is the highest level since March 2020. However, it remains just over a percentage point below January 2020’s pre–pandemic level of 63.4%. Before the April 2020 decline, the labor force participation rate had not registered below 62% since 1977. Despite the recovery of the past 23 months, the labor force participation rate remains at levels not seen since 1977.
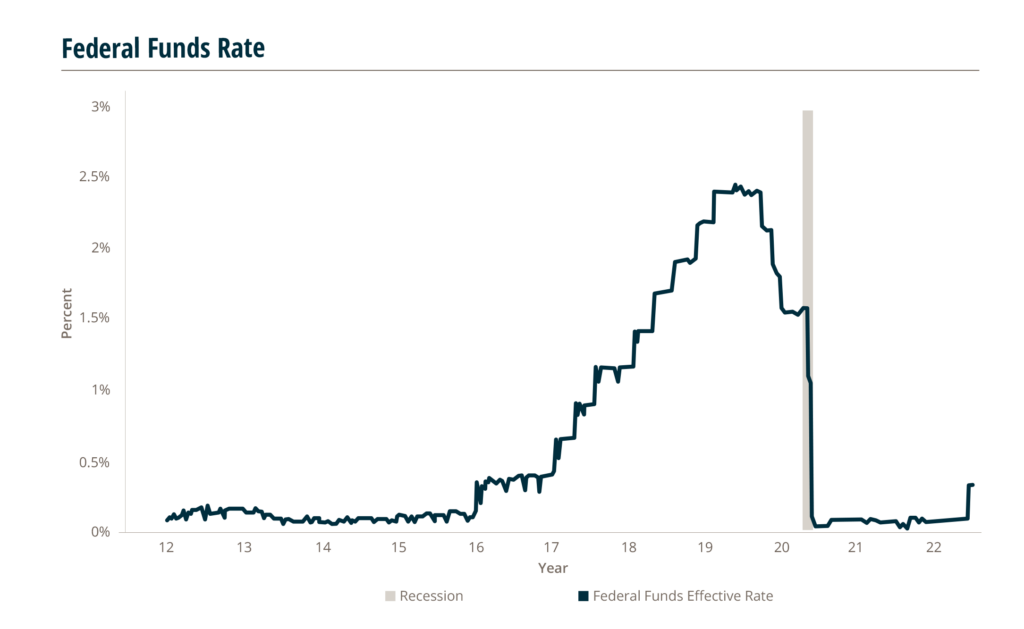
Federal Funds
On March 16, the Fed announced it was raising the federal funds rate a quarter–point to a range of 0.25%–0.5%. This was the first federal funds rate increase since 2018. Published assessments of the Federal Open Market Committee members indicate the Fed will take a hawkish stance in 2022, raising the federal funds rate target range to 1.75–2.0% over the course of the year to combat inflation. This implies six more quarter–percent increases this year. However, comments by Chairman Jerome Powell indicated that the Fed could consider quicker half–point gains instead of the standard quarter–point increases if appropriate.
Many economists project that the Fed will announce two half–point rate hikes at its next meetings in May and June. After the June meeting, this would move the Fed funds rate to 1.25% —1.5%.
The federal funds rate impacts both short and long–term interest rates. Although long–term rates are affected by several factors, including the economic outlook, inflation and rate expectations, and global demand and supply, the federal funds rate is a crucial driver of its level and direction. In turn, long–term rates affect consumer and business borrowing costs.
10 Yr. – 2 Yr. Yield Spread (Inverted Yield Curve) – Potential Predictor of Future Recessions
The difference between the yields on the 10–year Treasury and its 2–year counterpart went negative on April 1, creating an inverted yield curve, which later reversed. When that difference drops below zero, the yield curve becomes inverted for a period indicating that a recession is more likely. On Friday, April 1, the 2–year yield topped the 10–year yield. An inverted yield curve is a sign that has preceded almost every recession over the past 60 years.
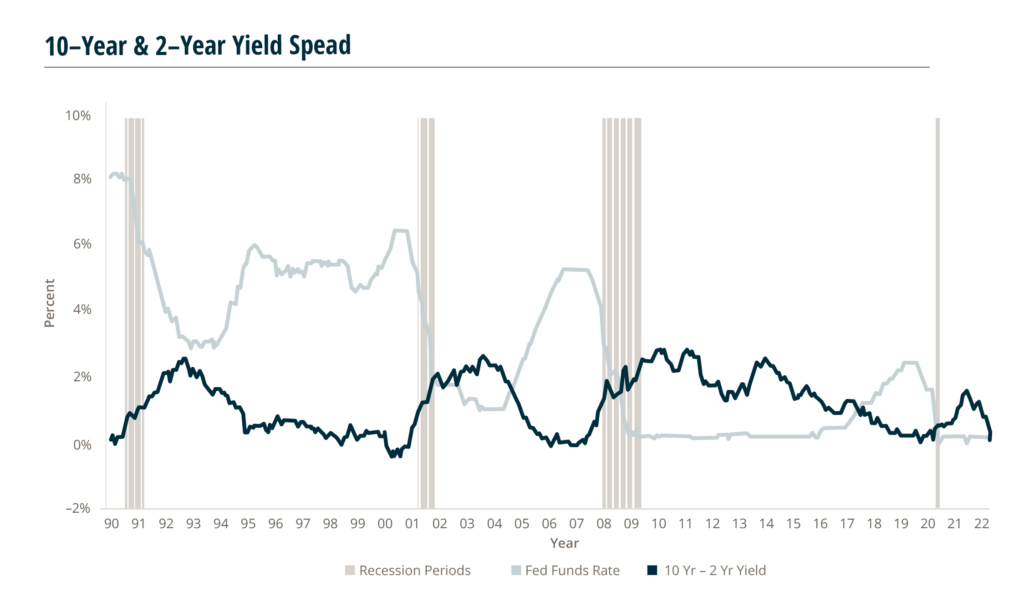
Reserve Bank of St. Louis. Most recent recession was March and April 2020
Here’s how insurance carriers could be affected by recession:
- Slower revenue expansion as business investment decreases and asset prices soften.
- Less investment income from long-term securities to pay for claims. Claims may become more expensive when paid further out in the future.
- Lower returns from investment portfolios compared to higher growth periods.
- Income from bond investments may fall short compared to rising costs. Given the risk of higher volatility to asset portfolios, insurers may want to look at methods to boost underwriting margins.
Even if the yield curve becomes inverted, a recession could take several years to set in.
However, insurance brokerages and carriers may want to consider various scenarios and assess how they will maneuver through potential volatility and macroeconomic changes.