Public Broker Performance April 2022
MarshBerry’s Broker’s Index
The latest performance and insights on the public broker composite.
Key Insurance Industry and Market Drivers
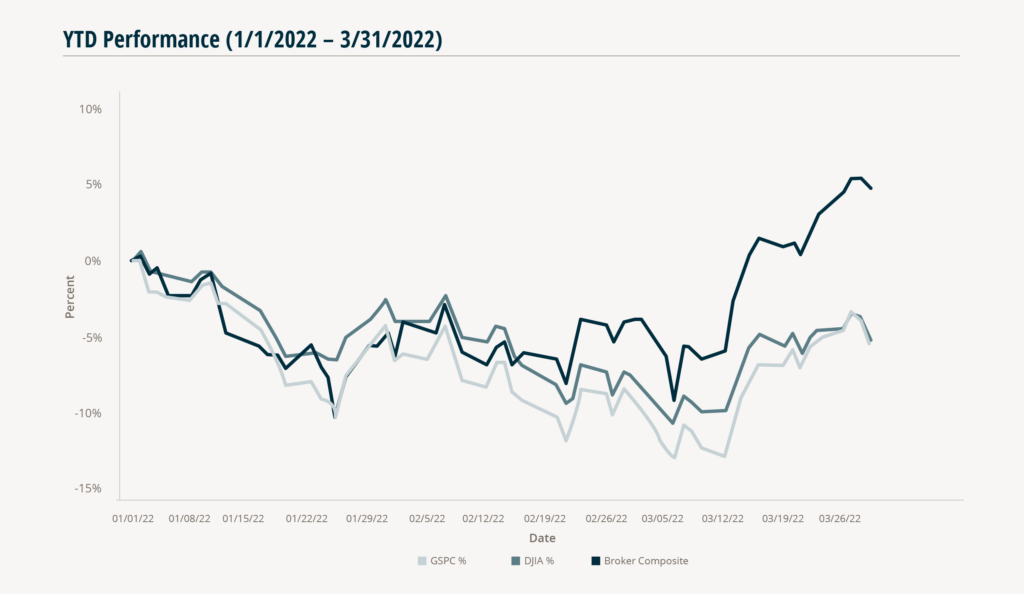
MarshBerry’s Broker Composite Index continued its outperformance year–to–date (through the end of March), highlighting the resilience of the insurance brokerage industry. While the S&P 500 decreased by 8.8% and Dow Jones Industrial Average dropped 7.4%, the Broker Composite Index outperformed with a decrease of 4.3% during this period.
– 4.3%
Broker Composite
– 8.8%
S&P
– 7.4%
Dow Jones
Investors’ concerns around the conflict between Russia and Ukraine, rising inflation, and tightening monetary policy all weighed on the performance of equities.
Insurance brokerage firms went through the Great Recession and the recent COVID–19 pandemic relatively unscathed. During 2009, the average insurance broker only declined 3.5% in commission income, indicating the industry’s resilience, and prompting an impressive influx of capital into the insurance brokerage.
The overall insurance brokerage industry continues to consolidate as larger insurance firms benefit from investments in effective technology, systems, and human capital to drive down customer acquisition costs. Furthermore, inflation could be a tailwind for some insurance brokers as premiums and exposure increase and pricing remains firm.
Share Price Performance of Public Insurance Brokers in 2022
Source: Yahoo Finance. This earnings summary has been prepared by Marsh, Berry & Co., LLC. and is not intended to provide investment recommendations on any company. It is not a research report, as such term is defined by applicable laws and regulations, and it does not contain sufficient information upon which to make an investment decision. It is not to be construed as an offer to buy or sell or a solicitation of an offer to buy or sell any securities, financial instruments or to participate in any particular trading strategy. These materials are based solely on information contained in publicly available documents and Marsh, Berry & Co., LLC has not independently attempted to investigate or to verify such information.
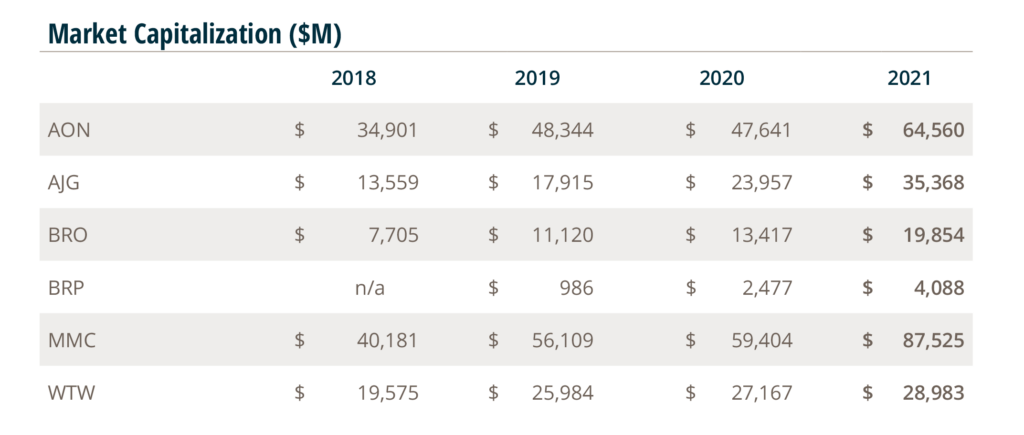

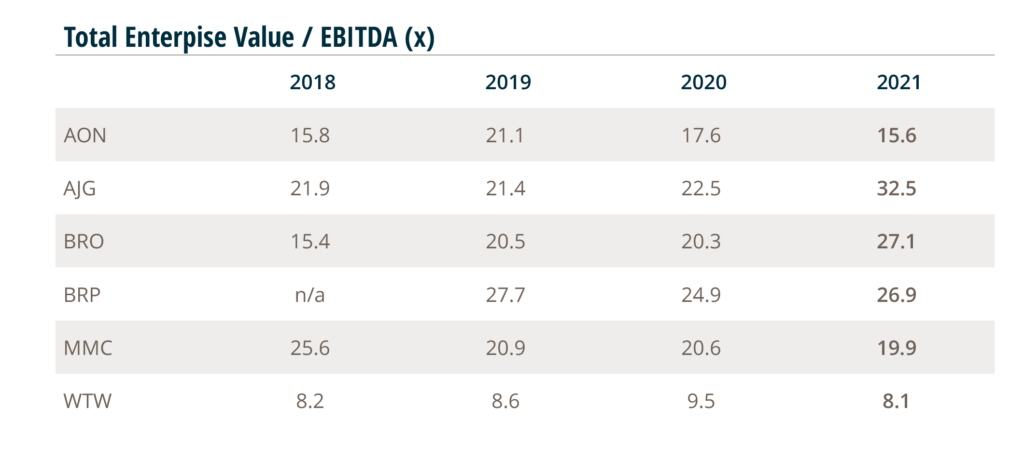
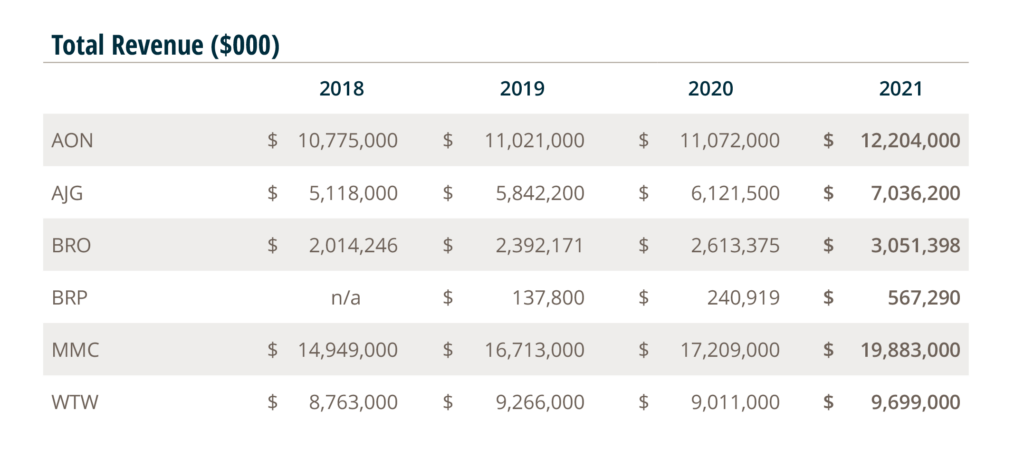
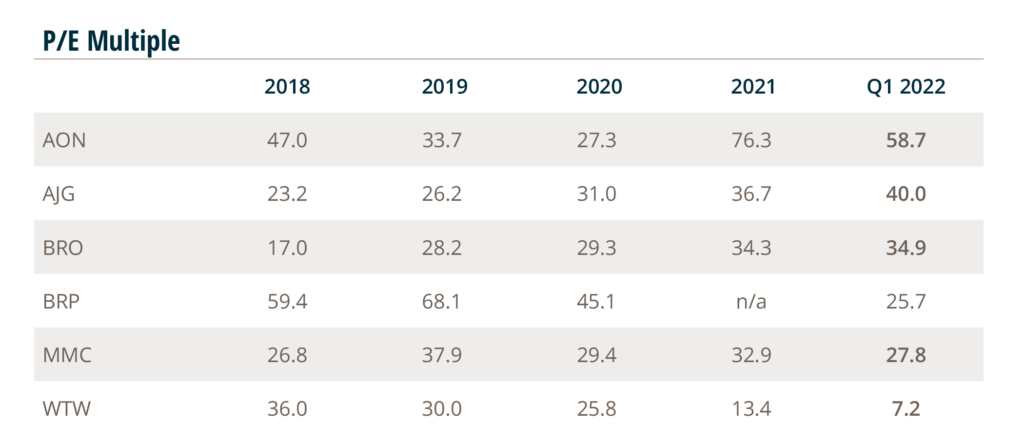
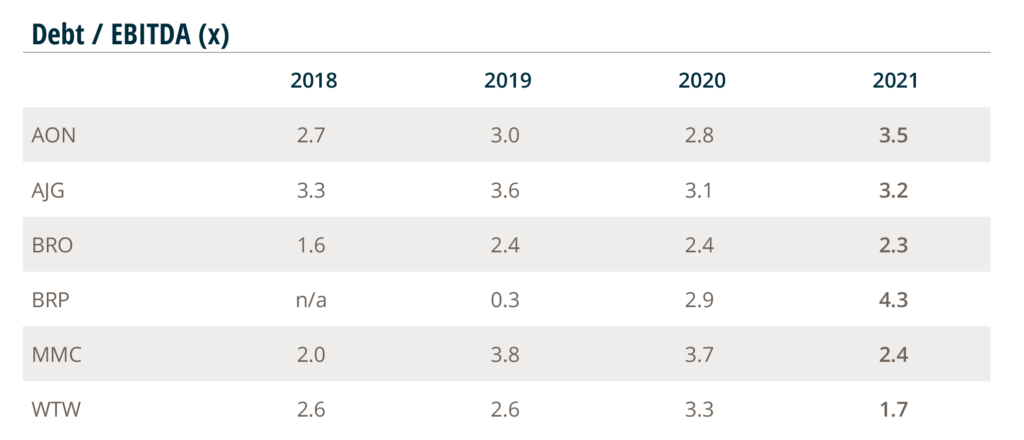
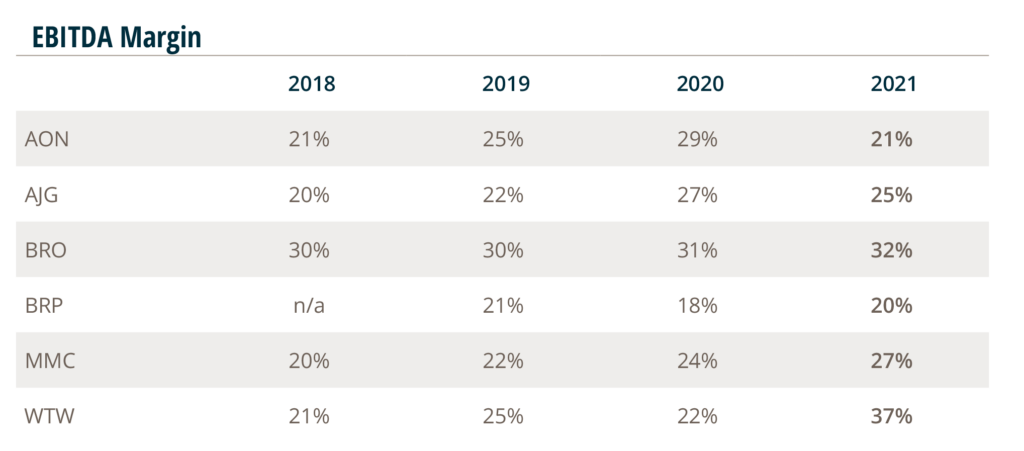
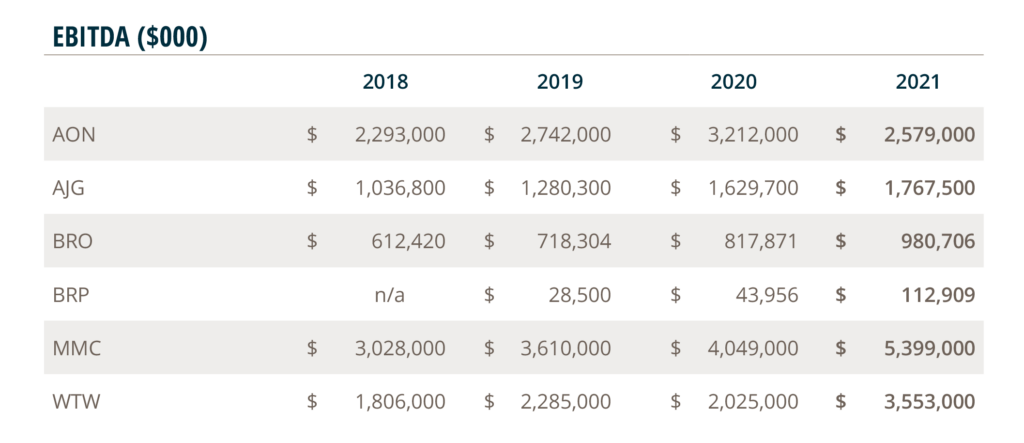
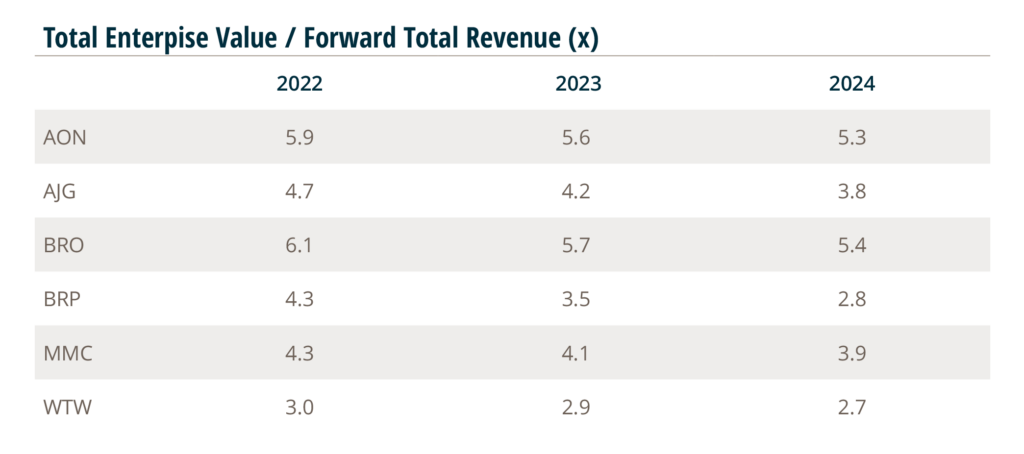
Sources: S&P Global, Company Reports, FactSet, 4/22/22. EBITDA: Earnings Before Interest, Taxes, Depreciation & Amortization. AON = Aon plc; AJG = Arthur J. Gallagher & Co.; BRO = Brown & Brown, Inc.; BRP = Baldwin Risk Partners; MMC = Marsh & McLennan Companies, Inc.; WTW = Willis Towers Watson Public Limited Company.
Source: Yahoo Finance as of 3/31/22 at close. BRP, BRO, AON, AJG, MMC, WLTW. This earnings summary has been prepared by Marsh, Berry & Co., LLC. and is not intended to provide investment recommendations on any company. It is not a research report, as such term is defined by applicable laws and regulations, and it does not contain sufficient information upon which to make an investment decision. It is not to be construed as an offer to buy or sell or a solicitation of an offer to buy or sell any securities, financial instruments or to participate in any particular trading strategy. These materials are based solely on information contained in publicly available documents and Marsh, Berry & Co., LLC has not independently attempted to investigate or to verify such information.