Industry Insights Vol III, Issue 1
MarshBerry’s Perspectives for High Performance (PHP)
Insights from MarshBerry’s proprietary financial database to help drive your business.
Minimizing the Impact of Leakage On Organic Growth
Leakage is the gap between the new business your firm has written in the past 12 months and your organic growth, or the difference between a firm’s organic growth rate and new business rate (aka “sales velocity”). It represents the amount of existing business you’re losing or failing to replace with new business.
To calculate leakage, simply take the difference between your firm’s organic growth rate and new business rate. For example, if your firm wrote 15% in sales velocity (new business as a percentage of prior year commissions and fees) and had an organic growth rate of 6%, its leakage rate would be 9%.

Leakage can be caused by several factors, such as soft market conditions, low client renewals, poor sales and marketing processes, or clients reducing their coverage. Brokers often note, “I can’t achieve high organic growth and have a low leakage number.” But that’s not entirely true. It is possible to achieve close to 20% organic growth and reduce leakage.
According to MarshBerry’s proprietary financial database, Perspectives for High Performance (PHP), the Best 25% of firms are growing organically at a rate of 18.7%.
Leakage negatively impacts sales velocity by slowing down the rate at which a business grows through new sales. Overall profitability and efficiency of the business may be reduced, costs can increase, and accounts may be lost. This problem puts additional pressure on your sales team since you need to generate even more new business than your sales velocity suggests.
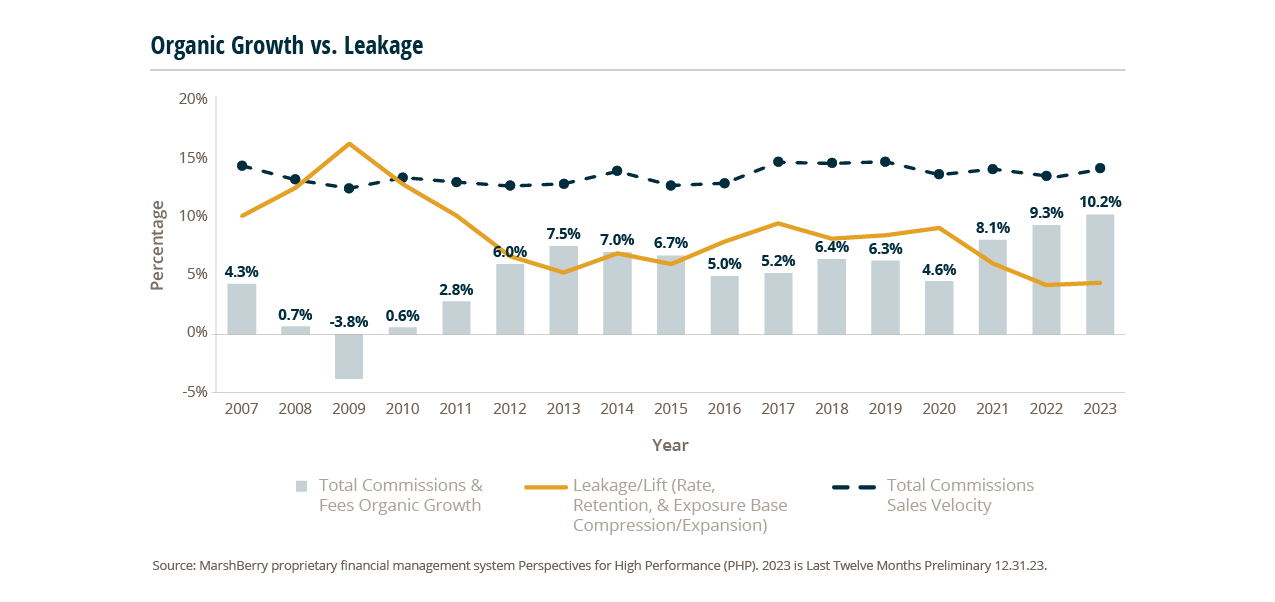
Looking at the broader industry over the last few years, as organic growth has increased, sales velocity hasn’t really changed, and leakage/lift has declined. Leakage/lift refers to a combination of leakage (lost business, because of something like a customer leaving) and lift (increased revenue from the same customers as a result of rising premium rates).
Many factors impact leakage, but there have been some changes over the past few years that have led to better sales revenue for brokers. For one, insurance premium rates have been increasing across most market segments and regions. New customer growth has remained steady and so has customer retention rates. But firms can’t rely purely on lift from market or industry conditions to improve leakage.
There are several ways to combat leakage. The easiest method is to simply write new business. Firms should also prepare for a softening market. Looking into new markets, creating process efficiencies, or moving from a generalist model to a specialist model can all help minimize the impact of leakage.
To enhance sales velocity and overall business performance, insurance brokerages often focus on implementing effective risk management practices, improving operational efficiency, investing in technology for fraud detection, and maintaining a strong reputation for customer service. These efforts contribute to a more robust and resilient business model, allowing insurers to attract and retain customers while sustaining growth.
Since so many things impacting leakage and lift are out of a firm’s control, firms who want to stand out should focus on improving sales velocity and emphasize new business production.
The Thriving M&A Landscape For L&H Specialty Distributors
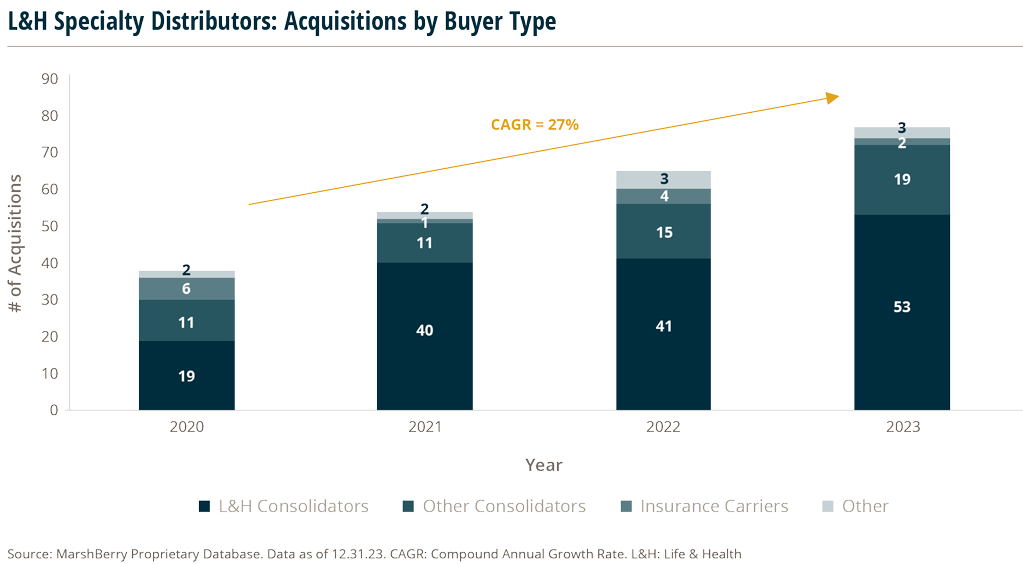
Expanding upon a striking trend observed in recent years, specialty distribution firms in the Life & Health (L&H) sector proceeded to achieve yet another remarkable year of record setting M&A activity. While this fact in isolation is noteworthy, the importance of this trend becomes more apparent when contrasting it with the declining M&A volume in the overall insurance distribution market, which demonstrated a 10.6% decrease from 2022 to 2023. Meanwhile, specialty distribution firms in the L&H sector surged ahead with an 18% increase in transaction activity, totaling 77 publicly announced deals in 2023.
From 2020 to 2023, deal volume for specialty distributors in the L&H sector increased at a staggering Compound Annual Growth Rate (CAGR) of 27%. In contrast, their P&C counterparts (both retail brokers and specialty distributors) exhibited a 7% decline in transaction activity over the same time period.
The brokers driving this trend include a group broadly referred to as “wholesalers” (Brokerage General Agents, General Agents, etc.) as well as delegated authority firms (Managing General Agents, Managing General Underwriters, etc.). In all cases, these firms typically sit somewhere between an insurance carrier and a retail insurance broker or financial advisor. Ultimately, these firms provide the broker/advisor’s clients with expertise in (and access to) products such as life insurance, employee benefits, annuities and more.
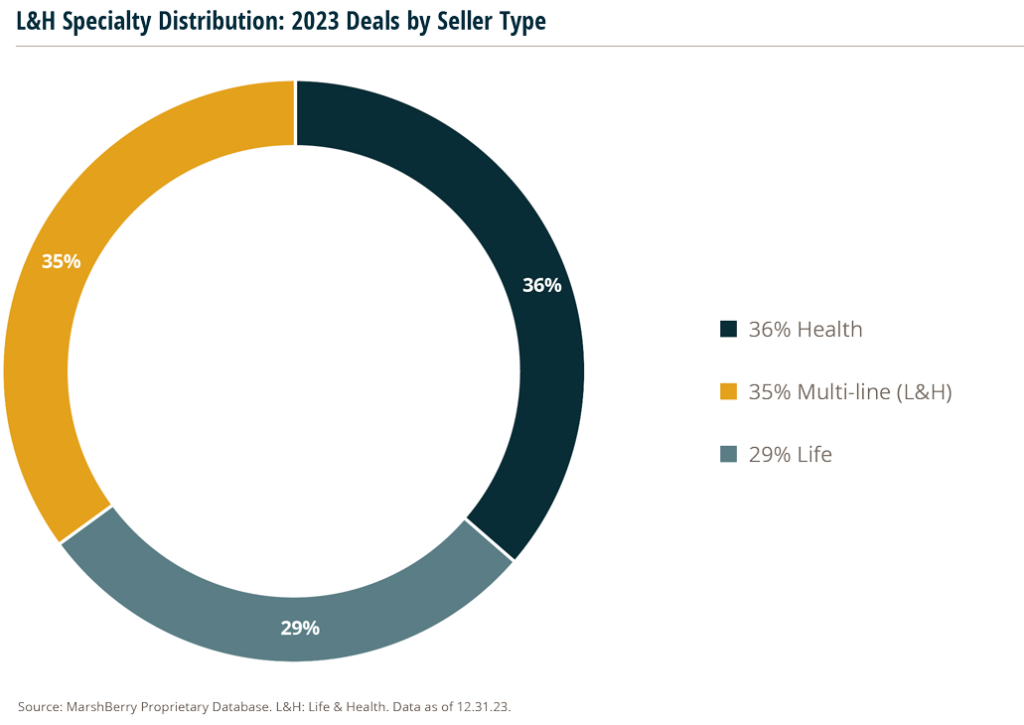
From a product offering standpoint, acquisitions in the segment were evenly distributed. Wholesalers of benefit products, commonly referred to as General Agents (GAs) or Field Marketing Organizations (FMOs), accounted for 36% of transactions in 2023. In comparison, life insurance wholesalers, often referred to as Brokerage General Agents (BGAs) or Insurance Marketing Organizations (IMOs), accounted for 29% of transactions. The remaining 25% of acquisitions in the sector were made up of multi line firms offering expertise in both life and health products.
Looking forward into 2024 and beyond, this consolidation trend undeniably has the potential to reshape not only the L&H sector, but the P&C sector as well. Following a period of heightened acquisition activity in the second half of 2023, many consolidators in the L&H space have expressed their intent to continue this momentum. As competitors of these buyers keep a close eye on this strategy, the entry of other consolidators into the segment is a real possibility, including pure P&C specialty operators who may be seeking a platform specialty L&H firm. Combining these factors with the macrotrends of decelerating interest rates, low unemployment rates, and growing economic optimism, the stage is set for another strong year of M&A activity for L&H specialty distributors.
Insurance Broker Profitability Remains Near All-Time Highs
Recent economic data is keeping consumers and investors on their toes, with inflation coming in stronger than expected and January U.S. retail sales weaker. As overall inflation numbers have eased in 2023 from the 9.1% peak in June 2022 — investors and analysts are eagerly anticipating when the Fed will begin to cut interest rates, after holding rates steady for four consecutive policy meetings.
Amidst this uncertainty and interest rates remaining at the highest level in over 20 years, insurance brokers continued to report EBITDA margins near all-time highs.
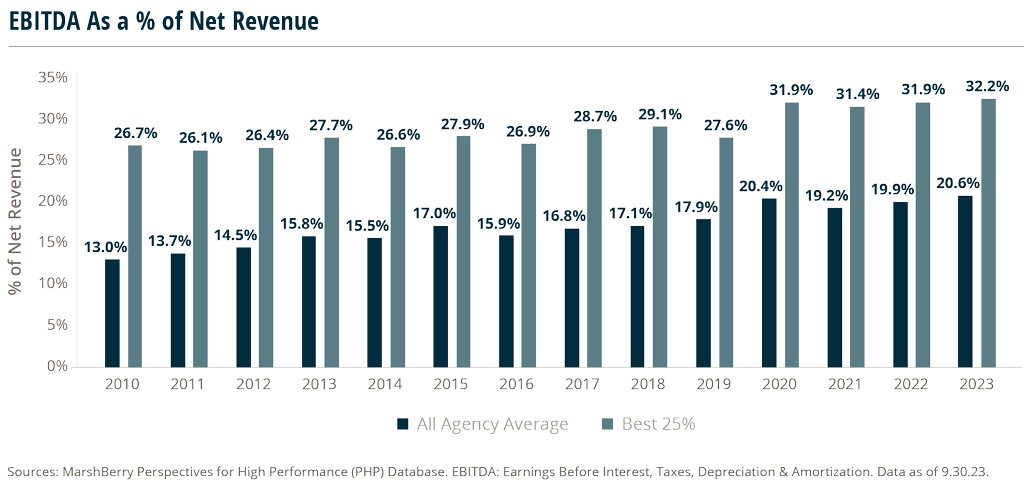
Based on MarshBerry data, in 2023 the average insurance broker saw EBITDA margins around 19.6% as a percentage of net revenue (through 9/30/23). Top performing firms (known as “Best 25%”) reached an average EBITDA margin of around 31.6%. Both are slightly below 2022 numbers, but respectable considering the challenging economic environment.
2023 saw ongoing strong top-line growth, boosted by premium volume increases and rising firm commissions, but some expenses increased. Selling expenses were flat in 2023, while operating and administrative expenses were slightly higher. Changes were slight but broad-based across all operating expenses, indicating rising costs possibly due to inflation.
Additionally, while insurance brokers have been successful at managing compensation expenses (one of their largest expenses), the labor market has continued to see rising wages over the last two years. In 2022, the average broker was able to manage compensation costs, with both payroll and benefits expenses declining as a percent of net revenue. However, this saw a very slight uptick through the first nine months of 2023.
It’s unclear whether insurance brokers will sustain their strong margins given the many unknowns in the economic environment in 2024. Two factors influencing the market include potentially fewer Fed rate cuts by year-end and an ongoing tight labor market. The derivatives market is pricing in four or five quarter-point Fed rate cuts in 2024, down from the projection at the end of 2023 for seven rate cuts.1 January 2024 jobs data indicated that the labor market remains solid — with 353,000 jobs added, above the Dow Jones Industrial Average projection for 185,000. The unemployment rate stayed steady at 3.7% in January, in line with December’s figure and below economists’ estimate for 3.8%.2 It remains to be seen whether the labor market will cool even further this year as the Fed navigates a full soft landing for the economy.