Macroeconomic Indicators Vol II, Issue 7
Market Trends and Current Statistics
Key macroeconomic indicators that are likely to impact brokerages within the insurance industry.
U.S. Household Debt Hits Record High
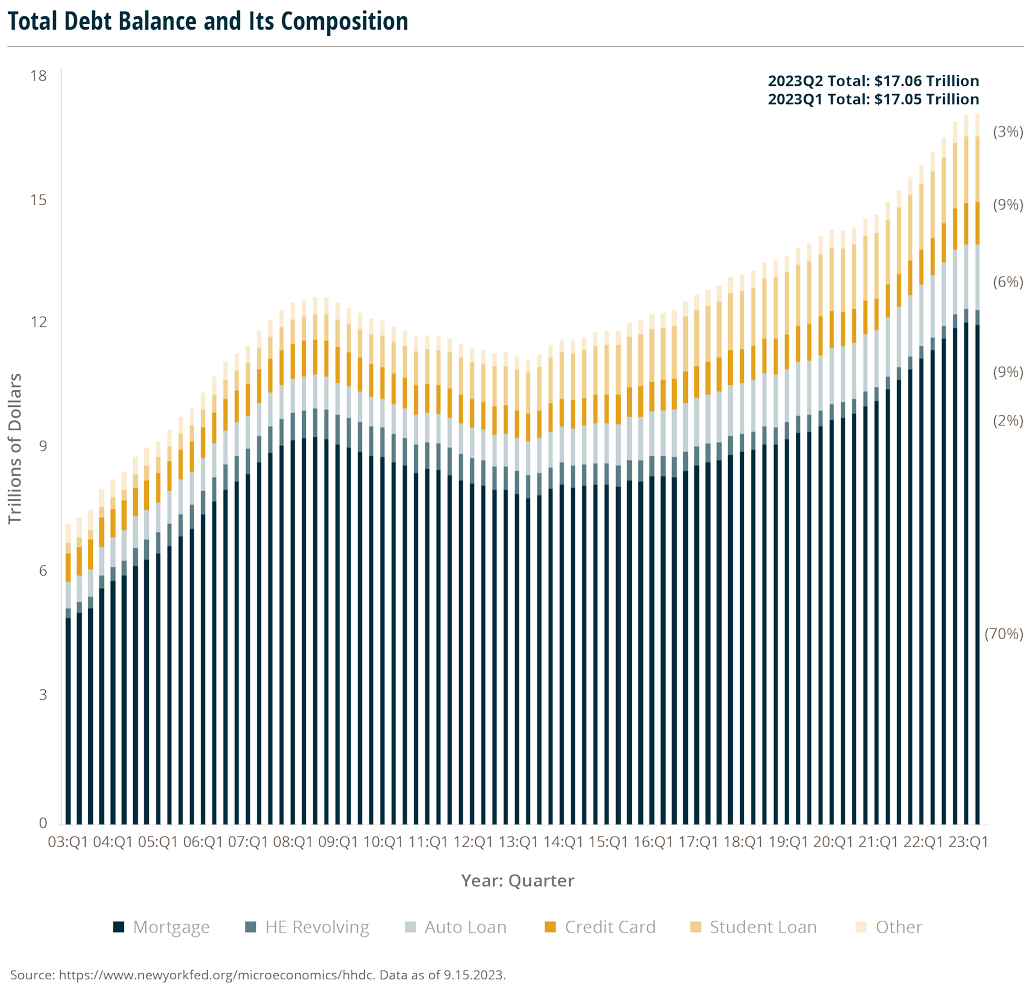
Total household debt rose by $16 billion to reach $17.06 trillion in the second quarter of 2023.1 Following suit, credit card balances experienced similar growth, rising by $45 billion to a record high of $1.03 trillion.1 This trend is not new – consumer debt has been growing steadily for the past ten years.
Despite getting some reprieve over the pandemic, due to higher savings rates, household debt is now hitting record highs.

The trend could become the new normal partially due to rising housing costs and increasing consumer spending inflationary pressures. Despite rising interest rates and two years of inflation, retail sales rose by 0.7% in July, the fastest pace since January, indicating that consumers are not slowing down on spending, regardless of price fluctuations. This, in conjunction with pandemic savings drying up, could signal a new consumer view on debt.
With more debt, often comes greater economic distress for households. Delinquencies on various kinds of debt are rising, but the rate at which people are falling into outright distress remains low.
Many borrowers will soon face additional debts on their balance sheet as $43.6 million dollars of student loan payments resume in October 2023.2
Economists at JPMorgan and Bank of America don’t expect it will slow consumers significantly, thanks to the strong labor market.3 Credit card spending data shows consumers that continued to pay down student debt during the pandemic spent more than those who paused their payments.4
Credit card and student loans are not the only type of debt increasing. The average monthly principal and interest payment among active mortgages was $1,355 as of June.4 That is up from a couple of years ago – but still below what it was in June 2011.
Economic stress isn’t spread evenly across the country. Texas had the highest delinquency rate out of the eleven individual states reported by the Fed’s household debt report – notable as Texans generally fared well during the 2008 financial crisis.
The strong labor market is continuing to buoy consumer spending for now, and despite indication that debt levels are increasing, consumer balance sheets are looking healthy. Economists are mixed on how long that can last with some expecting spending to slow after the summer months in categories such as travel, entertainment, and recreation. Others fear the trend of higher household debt may continue.
U.S. Surplus Premiums Point To Ongoing Strength In E&S
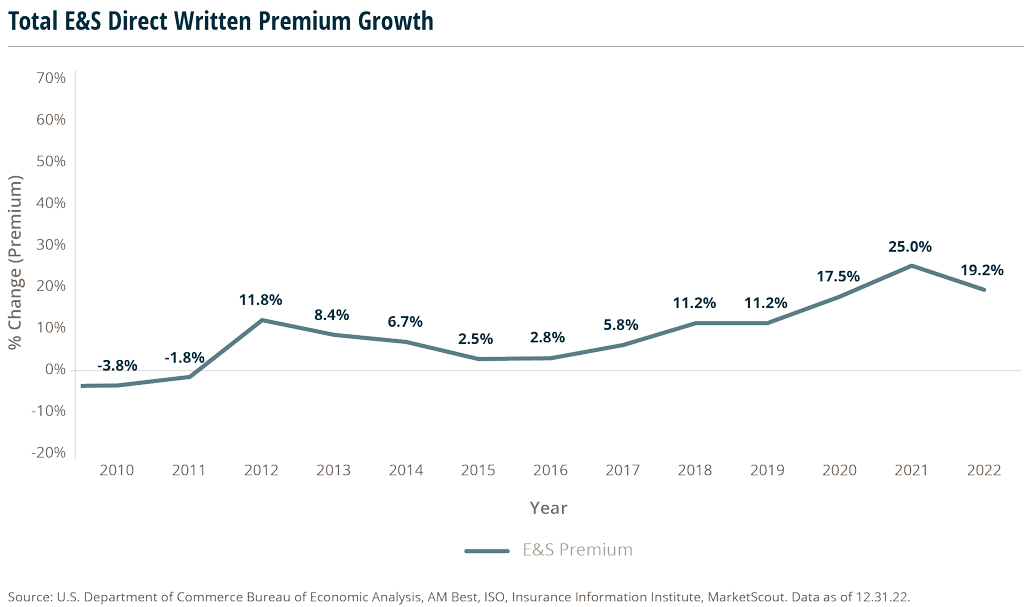
Premiums of U.S. surplus lines came in strong over the first six months of 2023, up 15.9% to nearly $36 billion, according to the Midyear Report of the U.S. Surplus Lines Services and Stamping Offices.5 Stamping offices accounted for 64% of all U.S. surplus line premium volume in 2022. The growth rate came in at about half of last year’s growth of 32.4% and record premium of $31 billion. While the rate of growth is moderating, this report shows that the Excess & Surplus (E&S) market continues to see strong growth. The graph below with data on broader total E&S premiums shows strong growth over the last few years.

The midyear report showed that some states have experienced increases in personal liability coverages such as homeowners and disability policies, but the overall E&S market continues to be dominated by Commercial Liability and Commercial Property.6 The Residential, Homeowners and Other Personal Property line of business had one of the highest growth rates year-over-year in 2022, potentially driven by increases in catastrophe-related issues. This year, the Stamping Offices released data broken down by lines of business for the first time.
MarshBerry projects that the E&S hard market will continue, with most rates firming in the next 12-18 months.
However, it could take longer to reach equilibrium – defined as loss-free accounts renewing at expiring rates with no increase or decrease. The drivers for the current hard market include continued weak investment portfolio returns for carriers (resulting from lower bond values and a volatile stock market), forcing E&S carriers to reach sustained profitability through continued rate increases (e.g., improved underwriting results). Increasing claims frequency and severity are also driving E&S carriers to seek rate increases. Nuclear jury verdicts, inefficiencies in claims-handling, and emerging risks such as intellectual capital theft are just some examples of increases in claims costs.
California and Florida are at opposite extremes
Among the large states for E&S business, Florida saw the biggest premium growth in the first half of the year at 34.7%, to $8.6B. Mark Shealy, CFO of the FL Surplus Lines Service Office, noted that this growth was largely driven by the commercial property market, which continues to experience price hardening and a reduction in policy counts. The hardening of commercial general liability was also a driver.
Following its rapid growth of 77% from 2019 to 2022, California’s premium saw a decrease of 2.3% year-over-year in the half year period ended June 30, 2023, much lower than the overall growth trend for the period. It’s general liability – which accounts for 25% of overall policies – decreased 8% from last year. Other lines, such as cyber, commercial difference in conditions, and multiperil homeowners are up nearly 50% in total premium. CEO and Executive Director of the Surplus Lines Association of California Ben McKay said, “Our experience in the first half of 2023 might indicate a softening of certain liability coverages, or we could be seeing a short-term aberration. California property lines clearly continue to experience a hard market.”
Sources:
1 https://www.newyorkfed.org/microeconomics/hhdc