Industry Insights Vol II, Issue 7
MarshBerry’s Perspectives for High Performance (PHP)
Insights from our proprietary financial database to help drive your business.
Revenue Drivers In A Hard Market May Not Tell The Whole Story
The average insurance brokerage firm’s organic growth rate is currently sitting at its highest point on record at 10.1%, according to MarshBerry’s proprietary financial management system Perspectives for High Performance (PHP). This continues a two-and-a-half-year trend for organic growth rates.
New business growth rates (or sales velocity) have remained relatively unchanged, registering at roughly the same level since 2017. Customer retention rates also held steady over the past several years. The combinations of these factors indicate the bulk of organic growth within the insurance brokerage industry is being driven by hard market conditions causing premium rate increases and thus commission increases.
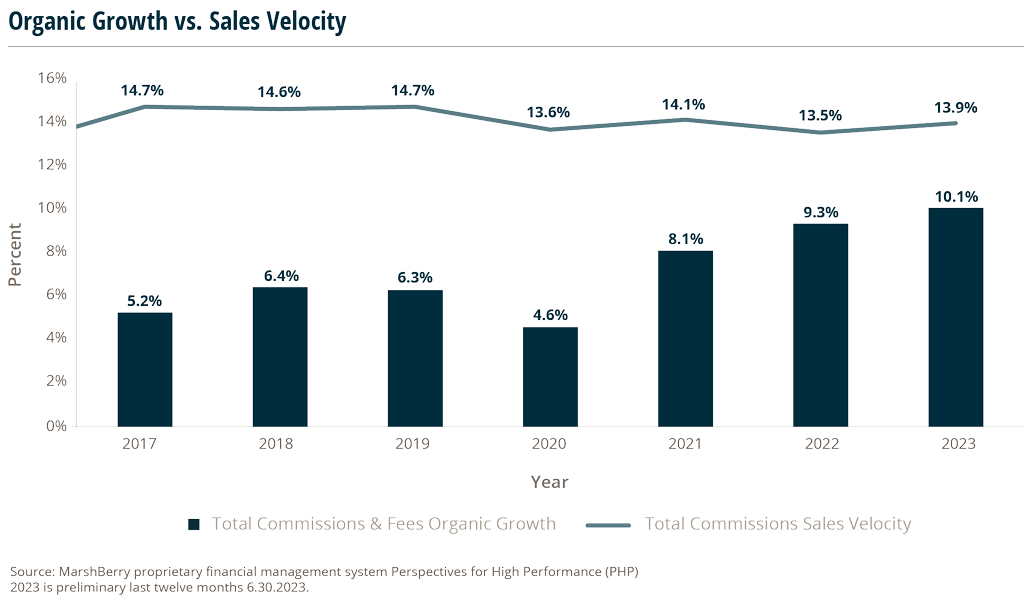
The average firm needs to realize that the current increase in organic growth is primarily driven by outside factors, and whenever these market conditions reverse, so will the strong organic growth rates.
Looking back at the 2008-2010 period, while average firms grew 0.7%, -3.8%, and 0.6% organically, the top 25% of firms averaged 11.0%, 6.4%, and 10.2% organic growth. To maintain a strong rate of organic growth, brokers need to focus on increasing sales velocity. Over the past decade, the average sales velocity of brokers in the top 25% of PHP has been close to 10 percentage points higher than the average of the database.
Some strategies MarshBerry suggests firms use to encourage new business growth include:
- Annual new business goal setting where expectations can be established and revisited.
- Structuring compensation with lower renewal commission percentages, incentivizing producers to focus on new business.
- Establishing minimum account thresholds where accounts smaller than an established threshold are moved to a small business unit where producers are not paid renewal commissions.
What Impact Does Shareholder Age Have On Organic Growth?
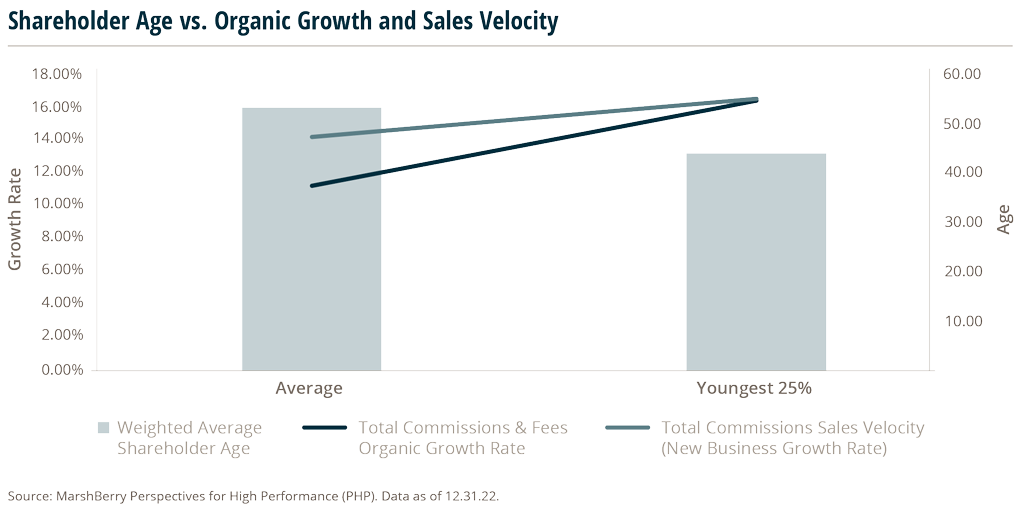
Firms with lower average shareholder age tend to have higher sales velocity and organic growth, according to MarshBerry’s proprietary financial management system Perspectives of High Performance (PHP). Data suggests that Weighted Average Shareholder Age (WASA) has a strong correlation with firm performance.
In fact, insurance brokerages with a WASA in their 30s and 40s grow two to three times more than firms with their owners in their 50s, 60s, and 70s.1
Firms should consider investing in younger producers because of these proven benefits:
- Growth, profitability, and valuation all tend to decline as agency owners age – younger staff can drive these areas in the right direction.2
- Offering ownership to younger employees encourages staff to focus on activities that drive growth and success. Producers who aspire to become stakeholders in the business should double down on things like outreach, marketing, and boosting sales numbers.
- Firms that invest in perpetuation tend to see increased value over time due to the potential of generating future profits.
- Offering ownership to younger high-performing employees creates a strong perpetuation plan and offers robust performance incentives, attractive to top talent.
- Younger shareholders may also be more likely to hire younger producers, creating a continuous cycle of higher organic growth rates.
To be clear, this data doesn’t mean that firms should default to younger staff overall, it’s about diversifying shareholder age. As a guideline, a WASA below age 50 is considered relatively low, with over 55 considered relatively high. Most firms have an average shareholder age of around 53.2 years and average producer age around 48.6, but studies have found that lower WASA and WAPA (Weighted Average Producer Age) are critical to successful long-term perpetuation.3
Are You Accurately Measuring The Success Of Your Producers?
It’s key to know where your firm stands in the market and use effective benchmarks to assess strength. For example, how do you know if your producers are growing their book at an acceptable rate? With the overall industry growing, it can be hard to determine if your producers are helping to grow your firm at an above-average industry rate.
Today, most brokers only measure a producer’s performance based on data they have on the other producers within their firm or based on a producer’s prior-year performance. While this approach may work, it does introduce limitations. A brokerage may have a small pool of producers, a newer firm may not have a good baseline, there may be a superstar producer, or there is little to no data on the remaining producers within the industry.
How do you evaluate your superstar producer if you have no other high performers to benchmark them against?
Wouldn’t it be helpful to have an external metric that gives a crucial data point of measurement vs. a peer group?
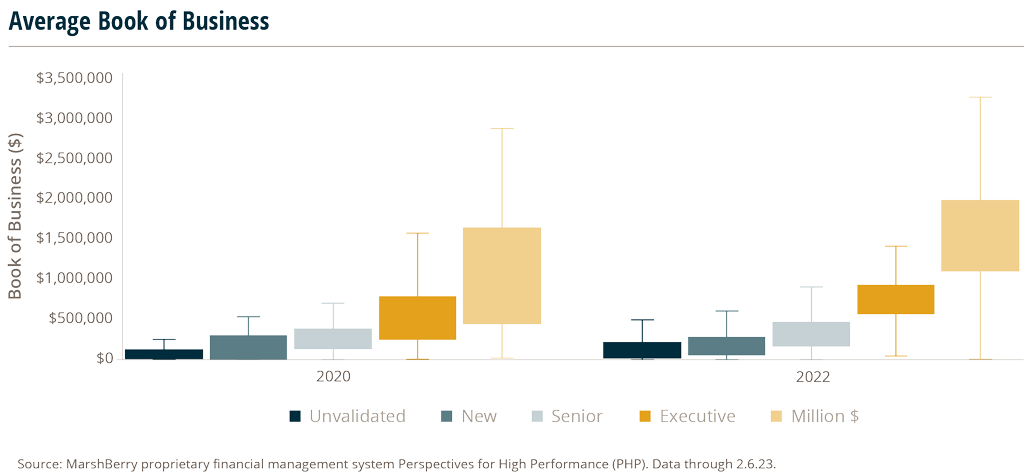
This chart shows the change in expected book sizes for different producer levels, between 2020 and 2022. The expected book sizes for producers have become more competitive, with each skill level having higher upper and lower quartile ranges. Producers should strive for their average book size to fall within the shaded regions above for their respective skill level, as that is where most producers within the industry are performing. Anything below the shaded regions signifies that they are performing below industry standards and are likely to be outperformed by their peers. The 2020 ranges for producers were more forgiving, allowing producers to have smaller book sizes (for their respective skill level) and remains competitive. However, in 2022, those ranges have become stricter and narrower.
The minimum threshold for million-dollar producers’ average book size has increased from roughly $500K to over $1M.
Similarly, executive producers need a minimum of a $550K book in 2022 to be considered ‘average,’ whereas in 2020 they only needed a book size of $300K. This trend is forecasted to continue with expected book sizes to increase to new standards, ensuring a more aggressive environment for producers.
MarshBerry’s newest advanced analytic tool, Producer Stack Ranking, provides relevant information on how your producers are performing on an individual level, while also being compared to all producers within MarshBerry’s proprietary database. This tool sheds light on whether your producers are growing at the rate of other similar producers within the industry.
These important employees are the lifeblood of the success or failure of the business. The importance of a “true” evaluation is crucial, and the Producer Stack Ranking can indicate how well your producers compare to every other producer within the insurance environment.
Sources: