Industry Insights Vol II, Issue 5
MarshBerry’s Perspectives for High Performance (PHP)
Insights from our proprietary financial database to help drive your business.
Labor Market Update: Tech Layoffs Continue, While Finance And Insurance Employment Levels Stabilize
Over the past several years, historically low unemployment levels, combined with job postings climbing to historic highs, resulted in upwards of two job openings for every unemployed person in 2022. However, in early 2022 the Federal Reserve began raising interest rates to combat inflation. In economic theory, rising interest rates should generally result in an increase in unemployment. But that is not exactly what has happened.
Towards the end of 2022, some companies, especially in the information industry (tech sector), began announcing layoffs – describing them as “trimming back on excess staff that were onboarded during an aggressive post-pandemic hiring spree.”
Job data from the U.S. Bureau of Labor Statistics (BLS) illustrates the three-month average of job postings in the information industry. Job openings nearly doubled between February 2020 and April 2022, rising 98.5% in that time. Since then, postings in the tech sector have declined steeply.
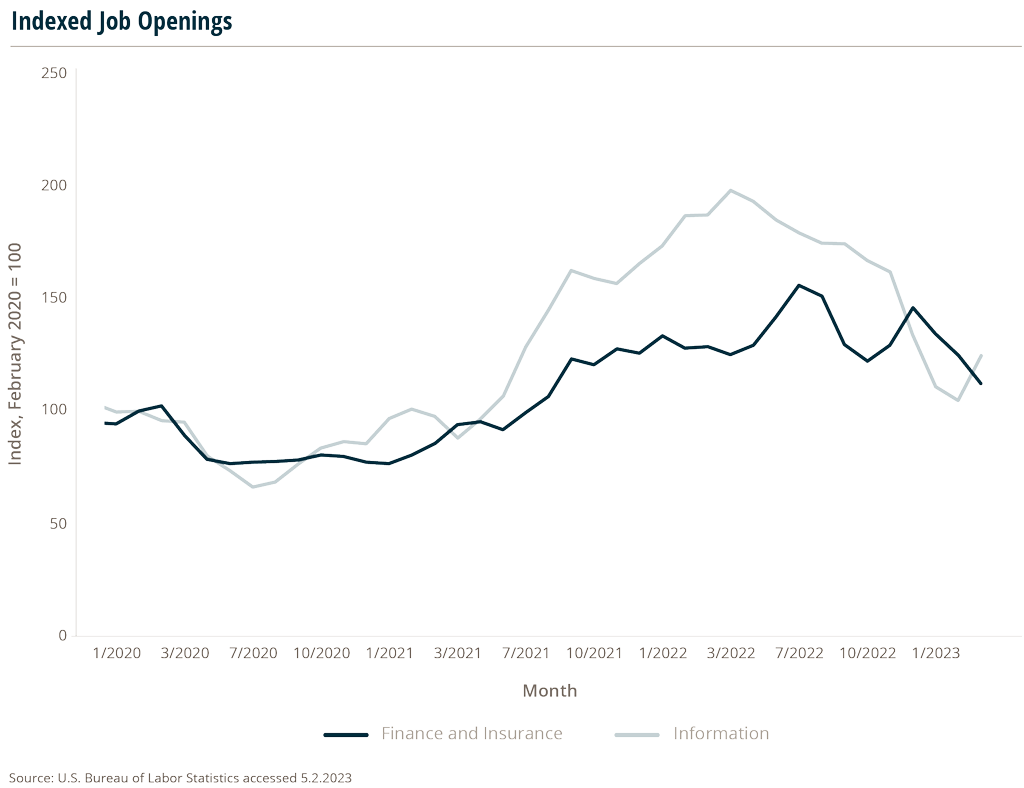
In comparison, job postings in finance and insurance have remained more level and have seen some of the lowest increases over the last couple of years. The financial industry, and insurance in particular, tends to move independently from the rest of the labor market.
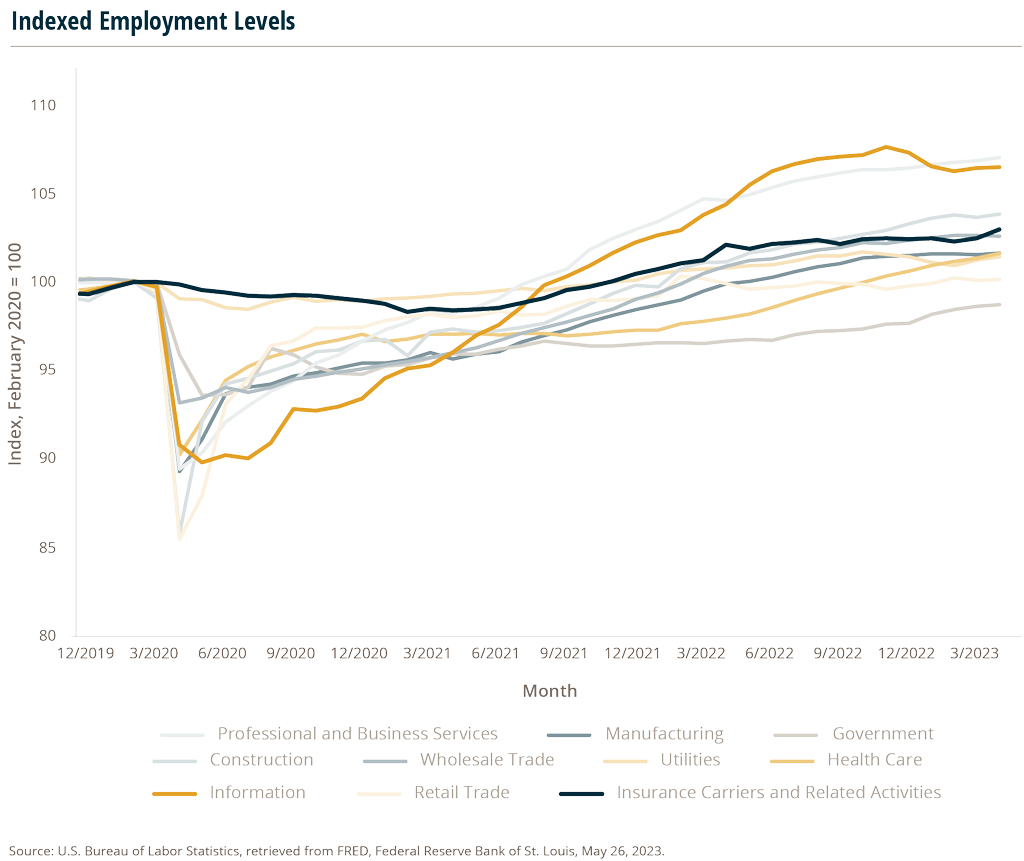
Data from the BLS shows that over the past three decades, YoY changes in employment levels in the insurance industry have had an exceptionally low correlation with changes in economy-wide employment levels. The only sectors of the economy that are less correlated include state governments, some health care subsectors, a few other financial service segments, and utilities. The finance and insurance industries saw some of the fewest staff cuts during the heart of the pandemic.
Between February and April 2020 (at the start of COVID-19), employment in the information industry , which includes many tech companies, fell 9.2% while total private sector employment fell 16.2%. Meanwhile, employment in financial industries dropped only 3.2%, with the insurance industry logging a total decline of -0.1% in that same period.
How To Set Insurance Company Goals Using Benchmarks
Mid-year is a good time to reflect on company and individual goals. From a sales perspective, it’s time to review your new business production goals for the year and determine if your team is on target to have Million Dollar Producers.
Regardless of location, product line, market conditions or capacity, all producers should have a career goal to become a Million Dollar Producer. Producers can either be on the path to becoming a high performing producer or the alternative, becoming stagnant and complacent.
Developing insurance agent goals
A first step to gain more new business, and eventually achieve Million Dollar Producer status, is simply believing that it can be done. To develop more Million Dollar Producers within your firm, categorize your producers in one of four new business production categories:
- New Producer: Those with less than three years’ experience.
- Senior Producer: Those with more than three years’ experience but less than a $500,000 book of business.
- Executive Producer: Those with more than three years’ experience and a book of business that is more than $500,000 but less than $1,000,000.
- Million Dollar Producer: Those with at least a $1,000,000 book.
Executives often set the bar too low and are limited to understanding and comparing performance based only on what their agents/brokers are currently producing. Instead, look at the bigger picture and compare production to hundreds of producers from across the country from different demographics and experience levels.
How to benchmark performance
For 2023, find out where your producers stack up against the competition.
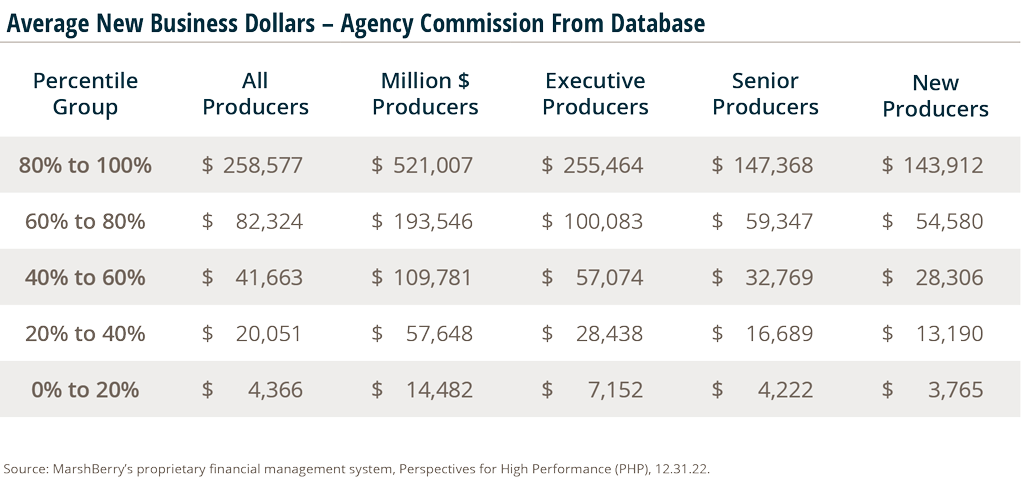
- Step 1: Plot your producers into one of the four columns in the New Business Dollars chart by identifying their book of business size and experience level.
- Step 2: Determine what percentile group they would fall into based on new business production from this year.
- Step 3: Set realistic, achievable goals and monitor their performance throughout the year.
If your producers aren’t in the top 20%, your goal should be to help them move up a least one percentile group. If you’re not sure where to begin, MarshBerry offers an advanced analytics tool called Producer Stack Rank that models statistics on how your producers are performing on an individual level compared to all producers within MarshBerry’s proprietary database. This tool can help reveal whether your producers are growing at the rate of other similar producers within the industry – or falling behind.