Industry Insights Vol II, Issue 2
MarshBerry’s Perspectives for High Performance (PHP)
Insights from our proprietary financial database to help drive your business.
Measuring The Financial Health Of An Insurance Brokerage
Two of the most important metrics used by companies to measure their financial health have both experienced a surge over the past few years. But both may be starting to come back down to earth.
Tangible net worth ratio is a significant measure of a company’s balance sheet stability and is critical to understanding the ultimate value of a company. It is calculated through the formula of total equity MINUS intangible assets DIVIDED by net revenue.
The trust ratio is calculated as total cash PLUS receivables and DIVIDING by payables. This shows whether a company is spending money that is supposed to be held in fiduciary trust for clients and carriers. It should always be above one.1
Both the tangible net worth and trust ratio peaked in 2020 and 2021. The reason for this peak could be due to COVID-19 and the implementation of the Paycheck Protection Program (PPP) loan in 2020, which was granted to many firms to help maintain payroll during COVID-19. This loan was forgiven, and a lot of firms reported this money as income in 2020 and 2021. This income would then be converted to equity (as part of the tangible net worth calculation) and cash (as part of the trust ratio calculation) on the balance sheet, which could help explain the recent rise in these two metrics.
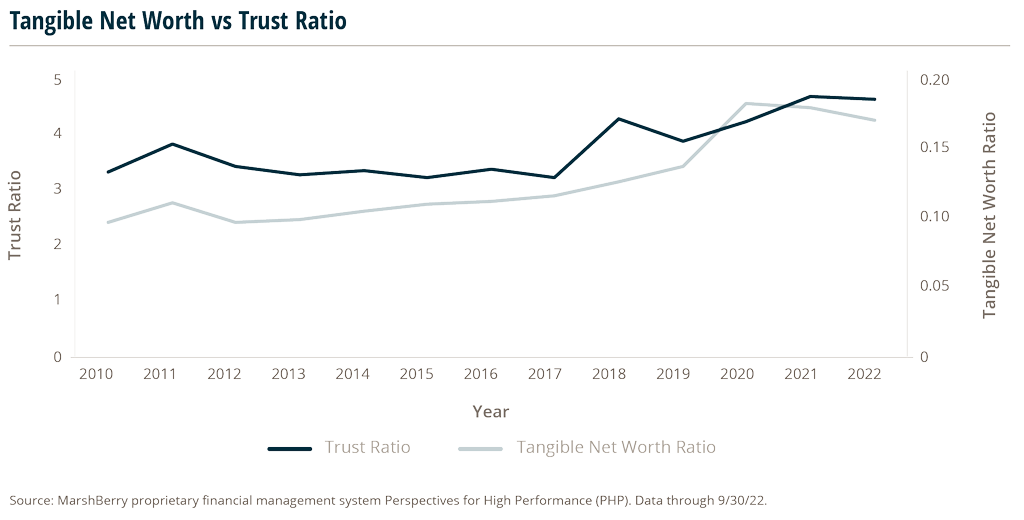
As of 9/30/22, the trust ratio began to fall back down, while the tangible net worth ratio is staying flat and close to its all-time high. This may continue to be the trend moving forward as equity is retained, and the cash might be used for other purchases. This will be an interesting metric to watch and see when these ratios trend back towards the prior 10-year average of 0.14 for tangible net worth and 2.8 for trust ratio.
The tangible net worth is likely to be less volatile compared to the trust ratio because the trust ratio is based only on cash and receivables, while the tangible net worth accounts for a company’s total value, which tends to be more stable. Tangible net worth staying near these highs indicates that insurance brokerage firms are in good, stable financial health, with the ability to scale if needed. The changes in this metric could be a good indicator of possible future shifts in financial stability of companies in the space.
Are Your Producer’s Keeping Up With The Industry? And How Can You Measure Success?
While projected to be more moderate in 2023, most personal and commercial lines will find this to be another year of rising premiums as firms continue to operate in a hard market. 2023 will be a tough year in a challenging market requiring agents and brokers to passionately recommit to doing everything they can to work smarter, find creative solutions, and anticipate client needs. The question is, with rate increases here to stay, are your producers growing enough to stay relevant in the industry?
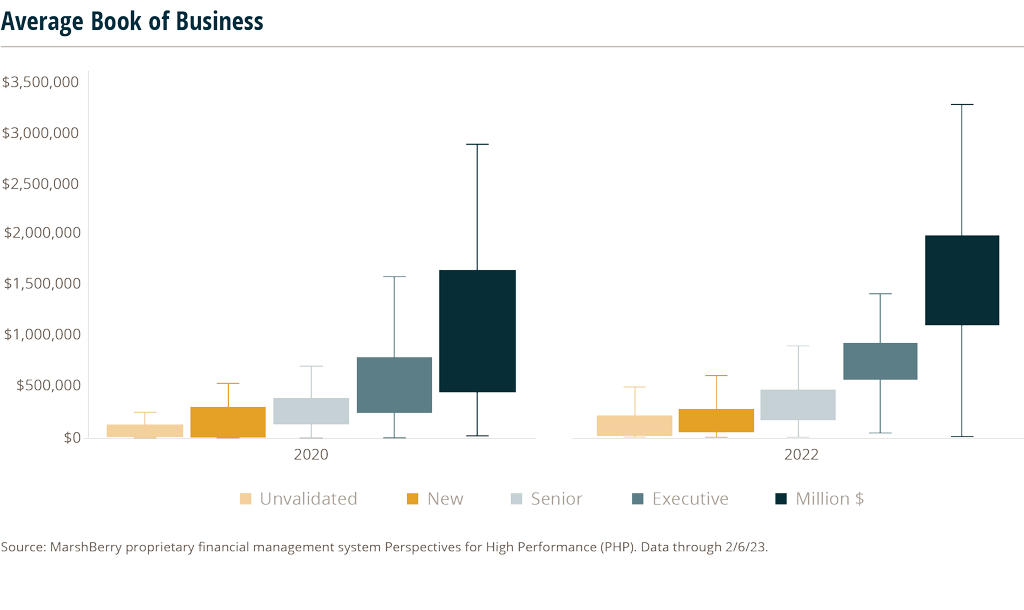
Since 2020, the expected book sizes for producers have become more competitive, with each skill level having higher upper and lower quartile ranges. Producers should strive for their average book size to fall within the shaded region (on the chart above) for their respective skill level, as that is where the majority of producers within the industry are performing. Anything below the shaded region signifies that they are performing well below industry standards and are likely to be outperformed by their peers. The ranges for producers were more forgiving in 2020, allowing producers to have smaller book sizes (for their respective skill level) and still remain competitive. However, in 2022, those rages became stricter and narrower.
The minimum threshold for million-dollar producers’ average book size has increased from roughly $500K to over $1M.
Similarly, executive producers needed a minimum of a $550K book in 2022 to be considered ‘average,’ whereas in 2020 they only needed a book size of $300K. This trend is forecasted to continue with expected book sizes to increase to new standards, ensuring a more aggressive environment for producers.
Producers are the lifeblood of the success or failure of the business, with organic growth and sales velocity as the leading indicators of a firm’s future success. Insurance brokers are highly reliant on producers to drive their business, but how do you know if your producers are growing their book at an acceptable rate?
Producer Stack Rank
MarshBerry’s newest advanced analytic, Producer Stack Rank, models relevant information on how your producers are performing on an individual level, while also being compared to all producers within MarshBerry’s proprietary database.
This tool sheds light on whether your producers are growing at the rate of other similar producers (and direct competitors) within the industry. With each producer focusing on expanding their own book, and the industry continually growing, it is hard to determine if your producers are giving you the competitive advantage needed to grow your firm at a rate to remain on top. The importance of a “true” evaluation is crucial, and the Producer Stack Rank can indicate how well your producers compare to every other producer going through the same struggles within the insurance environment.
For more information on how to get access to the Producer Stack Rank tool, or on how your producers can find more creative and innovative client solutions, reach out to a MarshBerry consultant to continue the conversation.
1 Not all states have legal requirements that insurance brokers and agents are in a trust, but it can be a good financial practice nonetheless.