Industry Insights November 2022
MarshBerry’s Perspectives for High Performance (PHP)
Insights from our proprietary financial database to help drive your business.
Average Age of Worker in Insurance vs. Other Industries
In the U.S. in 2021, the median worker age was 42 and the percentage of workers 55+ was 23.6%. In comparison, in the insurance brokerage industry, the median worker was 45.5, and the percentage of workers 55+ was just under 30%.1
Comparing the age of insurance broker employees against the overall economy isn’t particularly fair because the overall economy includes industries such as food service and retail where high school and college students often find part time jobs. Insurance brokers’ direct competition for talent probably isn’t shoe stores and restaurants. However, the insurance brokerage industry demographic looks “old” alongside other similarly categorized industries.
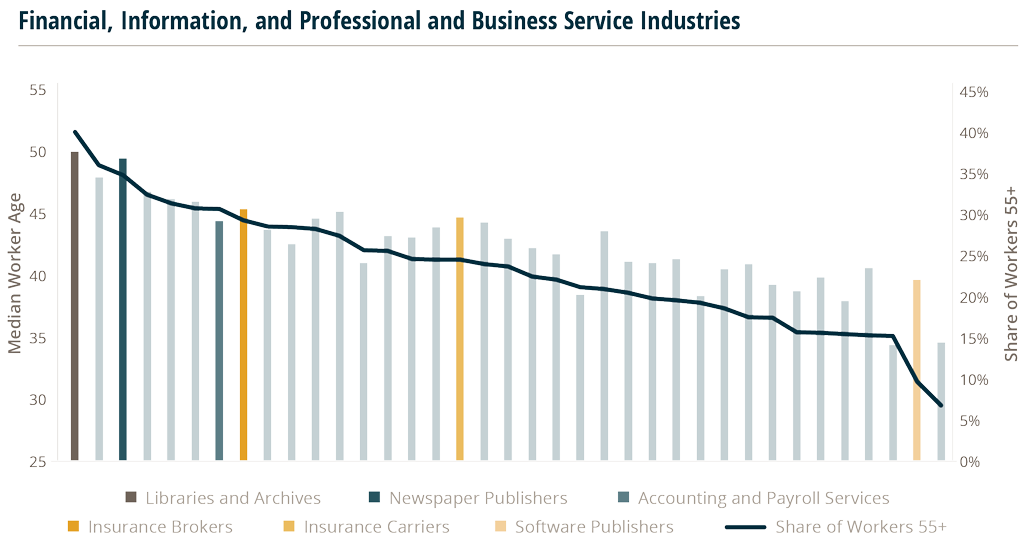
Surrounding insurance brokers in the oldest quartile of the selected industries (in terms of share of workers 55+) includes publishers, real estate lessors and managers, and accounting and legal services. The youngest quartile comprises data processing, computer systems, software, and internet publishers, advertising firms, and motion picture video and sound recording industries. While the labor force participation rate of the large demographic cohort known as baby boomers shrinks, there is not a corresponding demographic bubble of new workers aging into the labor force. In a 2021 report, the U.S. Bureau of Labor Statistics forecast total employment in the U.S. to average annual growth of only 0.1% between 2019 and 2030, compared to 1.3% between 2009 and 2019, and the labor force participation rate is expected to fall to 60.4% by 2030. For comparison, the labor force participation rate was 63.4% pre–pandemic in January and February 2020 and fell to a pandemic low of 60.2% in April.2
As one of the older industries in the U.S., insurance brokers will have to do more to attract talent from a labor pool that, though it is not expected to start shrinking, has started to stagnate.
E&S Market Impact from Inflation
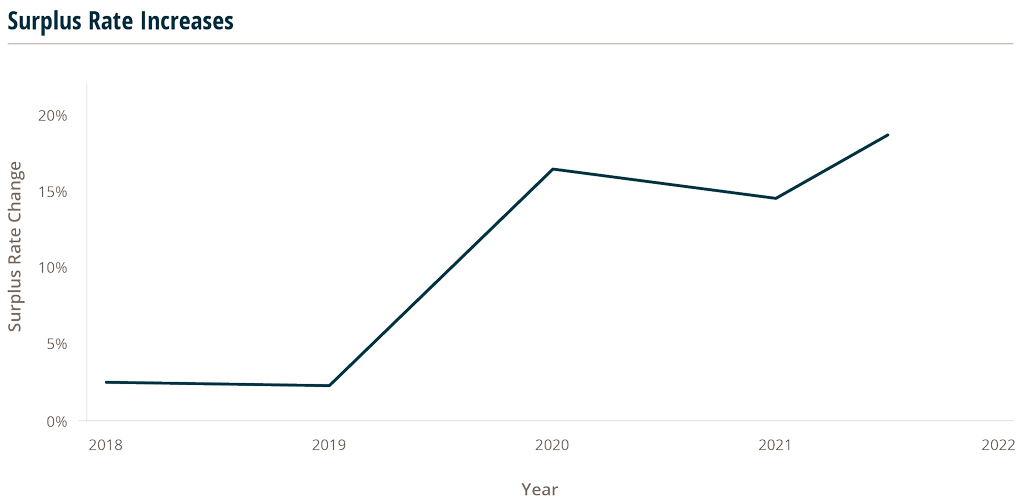
The Excess & Surplus (E&S) lines market has experienced significant rate hikes over the past three years. Data from 15 state surplus service and stamping offices indicates rates for 2020, 2021, and the last twelve–month period (LTM) ended June 30, 2022, have risen at a double–digit clip, a drastic pace compared to the mid–2 percent increases registered in 2018 and 2019.
The nature of surplus lines amplifies the market’s performance compared to standard admitted markets. Over the past few years, above average catastrophic losses, increasing risks from cyber ransomware attacks, and social inflation resulting from more expensive verdicts have driven premium pricing increases throughout the underwriting industry. This has also caused standard insurers to become more conservative when underwriting risks and moved some accounts to the surplus line market.
While these factors continue to act as economic headwinds for the insurance industry over the past year, economic inflation has also emerged as another headwind to deal with. Price increases in parts and materials will translate to higher premium pricing as insurers look to carry the reserves needed to cover claims. Rising economic inflation may even cause some accounts that previously found coverage in admitted markets to become too expensive for the standard carriers’ risk tolerance and further increase demand for surplus lines coverage.