U.S. Macroeconomic Indicators July 2022
Market Trends and Current Statistics.
Key U.S. macroeconomic indicators that are likely to impact firms within the insurance industry.
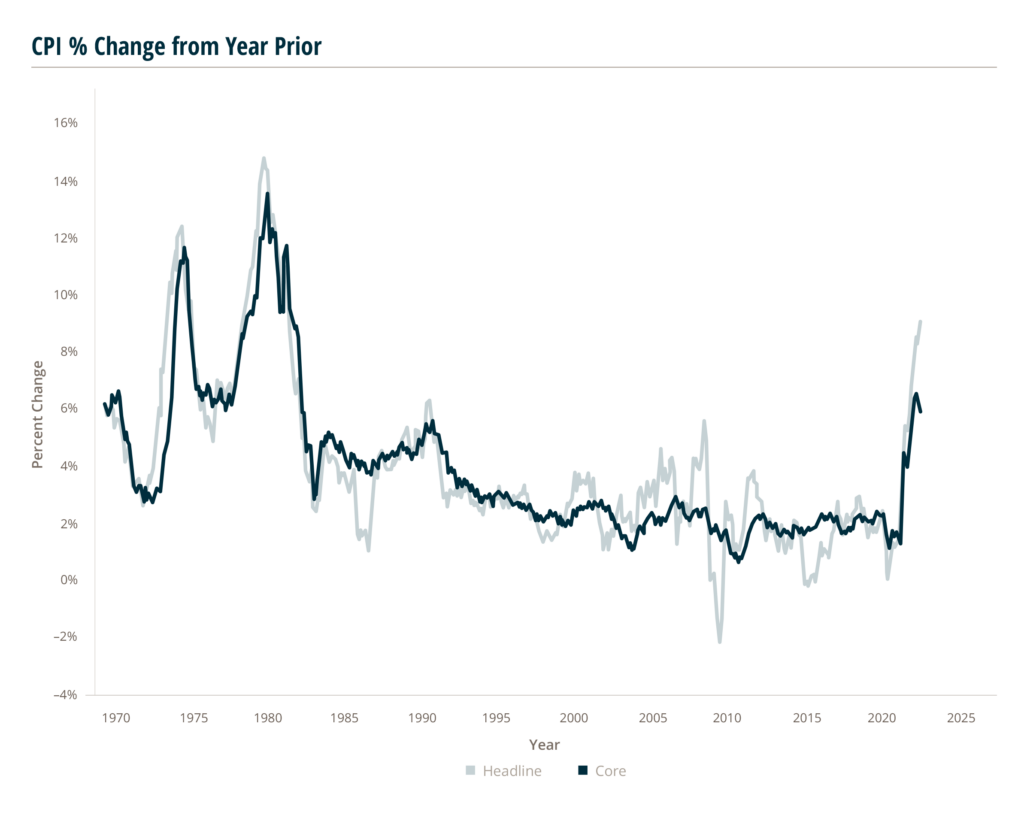
CPI Rises 9.1% in June, the Highest Increase Since November 1981
The CPI recorded a headline June increase of 9.1% over the previous twelve months. This is the highest year–over–year (YoY) increase since November 1981. Energy prices have seen the largest increase over the past 12 months, rising 41.6% as a category. Energy commodities (gasoline and fuel oil) have risen 60.6% while energy services (electricity and gas utilities) have risen 19.4%.
60.6%
Rise in Gasoline and Fuel Oil
19.4%
Rise in Electricity and Gas Utilities
Energy and food prices are the most volatile components of CPI, so to track long–run trends in inflation these components are excluded.
This measure, called core inflation, recorded a 5.9% increase in the CPI from the year before. Core CPI peaked at 6.5% in March and has begun to slow in the following months. However, it remains at levels that prior to this year had last been seen in August 1982. Vehicle prices have seen the largest increases among core CPI items, with used cars and trucks rising 7.1% and new vehicles up 11.4%. Transportation services have risen 8.8%.
7.1%
Rise in Prices for Used Cars and Trucks
11.4%
Rise in Prices for New Vehicles
The CPI is issued by the U.S. Bureau of Labor Statistics (BLS) and measures inflation based on surveys of what households are buying, in comparison to the other primary measure of consumer inflation, the Personal Consumption Expenditures (PCE) Price Index, which measures inflation through surveys of what businesses are selling.
Source: U.S Bureau of Labor Statistics, July 13, 2022.
Could the Fed Raise Rates by Another 75 Basis Points in July?
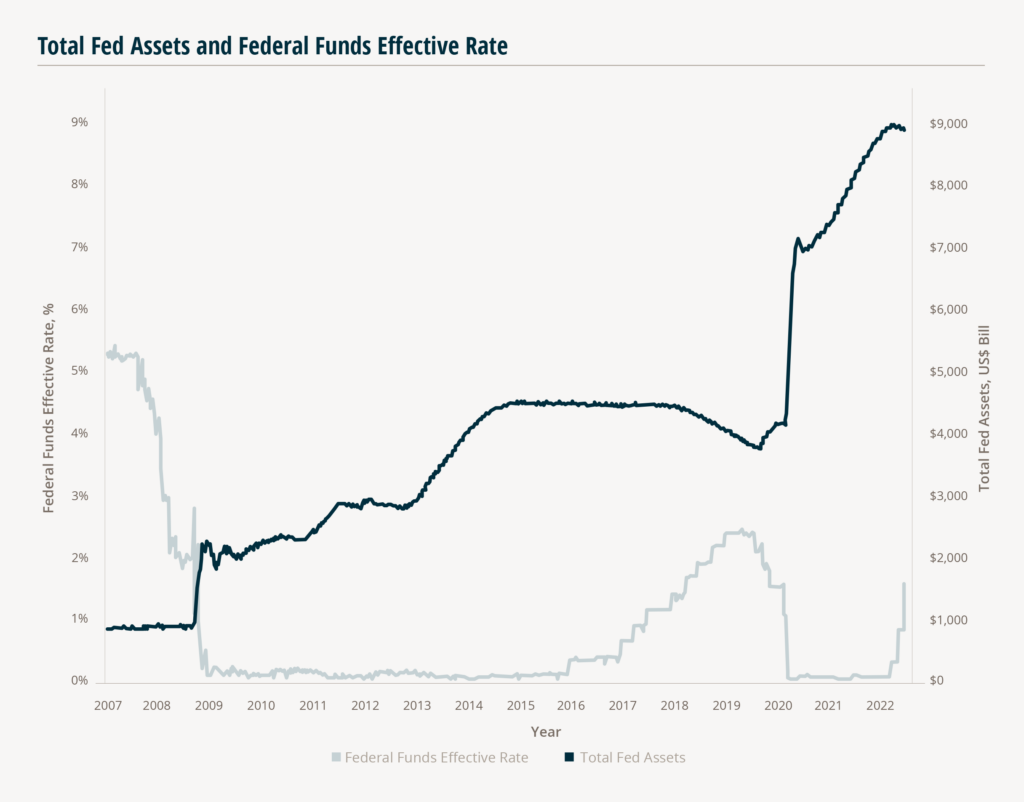
On June 15, the Federal Reserve (Fed) raised the federal funds rate ¾ points to a target range of 1.5–1.75%. This was the first time the Fed has raised the target range by ¾ of a percent since 1994 and was a departure from the half percentage point increase that previous guidance from the Fed had indicated. In its statement, the Fed indicated it anticipates ongoing increases in the target range will be appropriate as the Committee seeks to reduce inflation.
Following that 75 basis point benchmark interest rate hike, several senior members of the Fed are anticipating another potential increase of 75 basis points during its July meeting (July 26–27). San Francisco Federal Reserve Bank President Mary Daly stated that a 75 basis point increase in July is her “starting point,” although she sees that potentially moderated if the economy slows more than expected.
Federal Reserve Bank of Cleveland President Loretta Mester, a voting member of the Federal Open Market
Committee (FOMC), said that she will advocate for a 75 basis point increase at the next FOMC meeting in July if economic conditions remain the same at that time. The Fed has been committed to use the funds rate to bring down inflation, as it runs at the fastest rate in about 40 years.
According to a Reuters poll of economists on June 17–21, a majority project the federal funds rate to be in a range of 3.25%–3.5% by the end of 2022. This projection is 75 basis points higher than expected in a poll two weeks earlier. About 75% of this group also see another 75 basis points increase at the July FOMC meeting. In its published projection materials released on June 15, assessments of the members of FOMC had indicated the participants anticipated the target range for the federal funds rate at the end of 2022 will fall somewhere between 3.0% and 4.0%, with a median of 3.4%. The rate is expected to be even higher in 2023 with a median projection of 3.8%.
Housing Starts & Construction Spending Start to See Signs of Decline
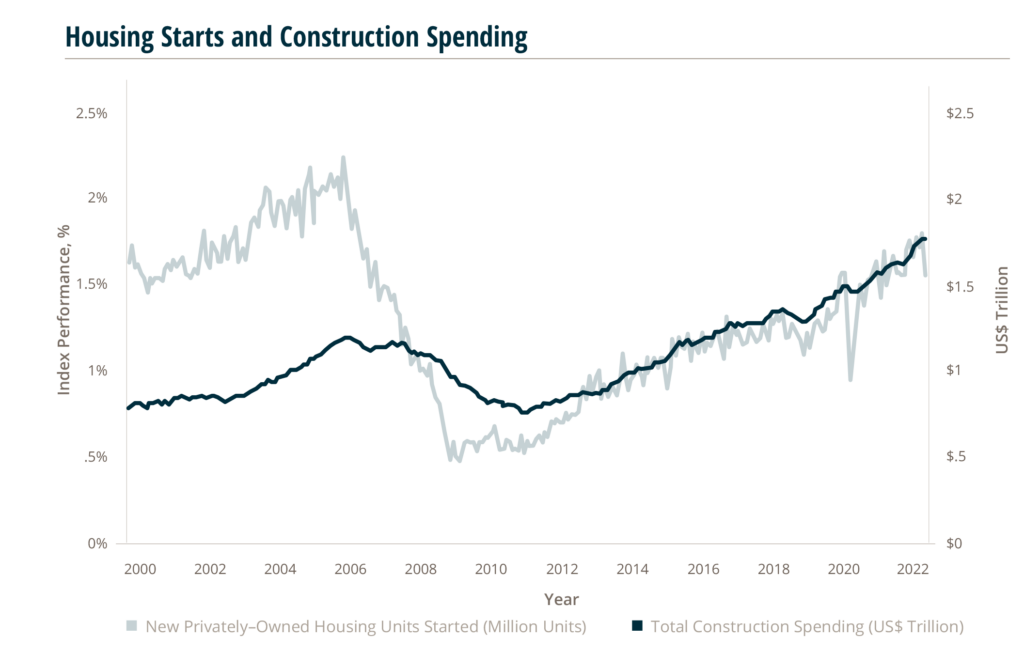
Construction spending has seen nearly two years of steady growth since rebounding from pandemic–induced declines in April and May 2020. Gains have primarily been driven by increases in residential construction spending, which has experienced seasonally adjusted annual growth in every month since May 2020. However, there is some indication this long–term trend is about to change.
Total new privately–owned housing starts fell in May to 1.5 million units, the lowest point since April 2021. Just a month prior, in April 2022, total starts had registered above 1.8 million units for the first time since the 2007–2009 recession. While this is a volatile indicator that often experiences large month–to–month swings, May’s drop is the largest since the early months of the COVID–19 pandemic.
Additionally, in April, the average rate for a 30–year fixed mortgage rose above 5% for the first time since 2011 and it has continued to rise in the following months. The Fed raised the fed funds rate by 0.75 points in June, the first increase of that magnitude since 1994, and is signaling continued rate hikes should be expected for the near future. A continued rise in interest rates will probably shrink the pool of buyers in the market for a new home, and this could in turn result in further declines in new housing starts and cause a decline in overall construction spending.
5/18/22, Total Construction Spending released July 1, 2022.
The S&P 500 Moves into Bear Territory and Sees the Worst H1 Performance Since 1970
The S&P 500 had its worst first half (H1) performance since 1970, reporting a drop of 21% since the start of 2022, after falling into a bear market on June 13.
21%
Drop in S&P 500 since the start of 2022
Analysts are seeing the potential for a recession as the Federal Reserve (Fed) acts aggressively to tamper high inflation with interest rate increases, while GDP slows. The S&P 500 index officially entered a bear market, closing down over 20% below its all–time record close on June 13. This follows the Nasdaq composite which fell into a bear market earlier in the year.
20%
Below all–time record close of S&P 500 on June 13
Historically, the confirmation of a bear market leads to additional market declines. In the 17 cases of bear, or near bear, markets since World War II, the confirmation of a bear market has resulted in a further drop to the S&P 500 with the conditions lasting on average for one year, while producing an average top to bottom decline of just under 30%.
On average, over the same period, bear markets have gone from peak to trough in about 13 months and taken 27 months to recover to break even. A bear market also tends to be less severe if a major index falls quickly into bear market territory.
“The good news is that the bull market took just 161 calendar days to go from its peak to a 20% decline threshold—compared to an average of 245 days in past bear markets,”
Sam Stovall, chief investment strategist for CFRA Research.
Based on data going back to 1945, a faster decline into a bear market tends to lead to smaller drops (of under around 27%) rather than large declines of 40% or more.
Furthermore, looking at historical data on poor first half performances for the S&P 500 for hints of future performance: in the second half of 1970, the S&P 500 gained 27% (after dropping 21% in the first half). In 2020, the index decreased 4% in H1, while rising 21% in H2. It’s difficult to predict how the second half will shape up. In the years when the S&P 500 had a negative first half (since 1957), the benchmark registered a negative second half about 50% of the time, according to S&P Dow Jones.
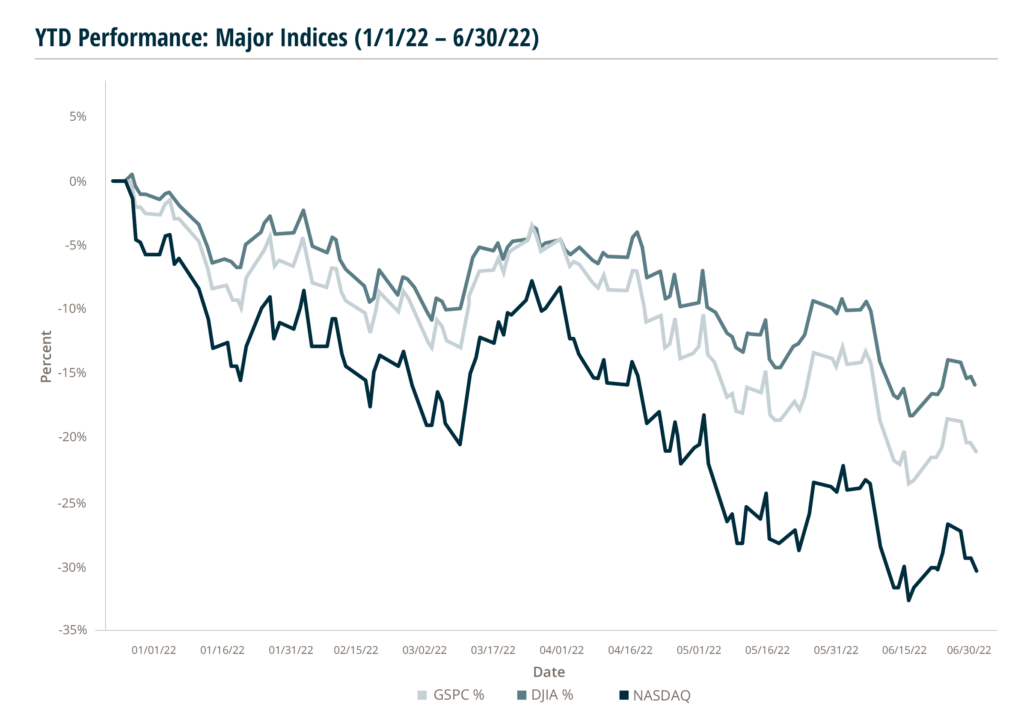
Nasdaq
– 30.3%
S&P
– 21.1%
Dow Jones
– 15.9%
Source: Yahoo Finance, June 30, 2022.