U.S. Macroeconomic Indicators August 2022 August 2022
Market Trends and Current Statistics
Key U.S. macroeconomic indicators that are likely to impact firms within the insurance industry.
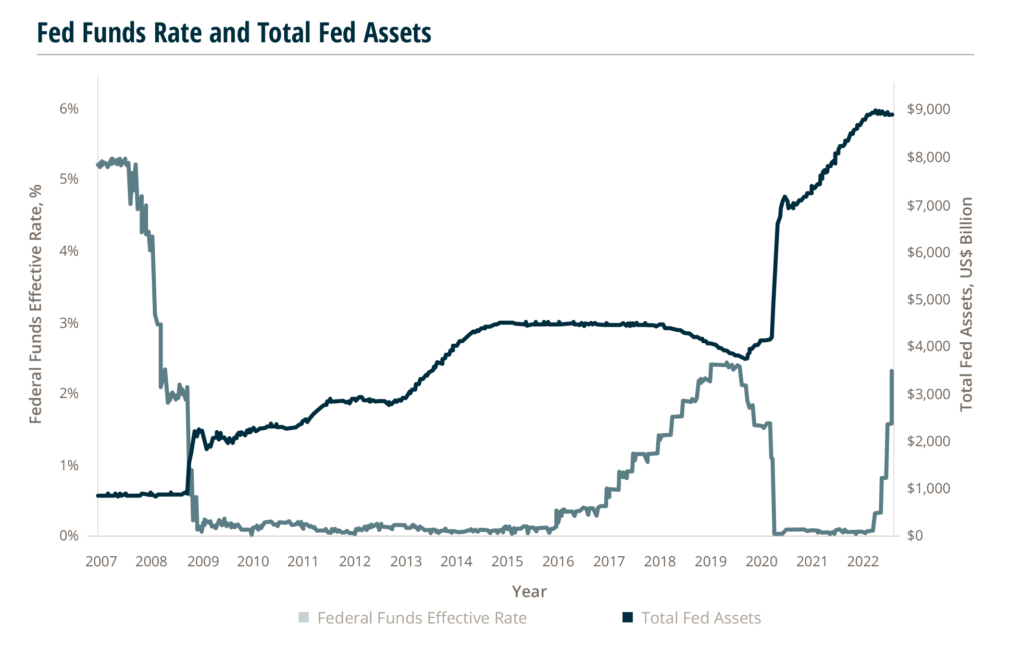
Fed Raises the Federal Funds Rate by 75 Basis Points, May Do So Again to Fight Inflation
On July 27, the Federal Reserve (Fed) raised the federal funds rate target range from 2.25% to 2.5%. This was up from the prior range of 1.5% to 1.75% in June. This is the second consecutive increase of 0.75 points. The Fed has now raised its target federal funds range at four successive meetings as it seeks to combat high inflation and return it to the Fed’s 2% objective. Prior to June’s 0.75 point target range increase, the Fed had not raised the federal funds target by more than 0.5 point since 1994. The Fed also continues to reduce its asset holdings as an additional measure to fight inflation. In its statement, the Fed noted that unemployment has remained low and job gains have been strong in recent months while inflation continues at elevated levels, and it anticipates ongoing increases in the target range will be appropriate.
The federal funds rate has an impact both on short and long-term interest rates. Although long–term rates are affected by several factors, including economic outlook, inflation expectations, rate expectations, and global demand and supply, the federal funds rate is a crucial driver in affecting its level and direction. In turn, long–term rates affect consumer and business borrowing costs.
Inflation Rises 9.1% in June, Higher than Expected
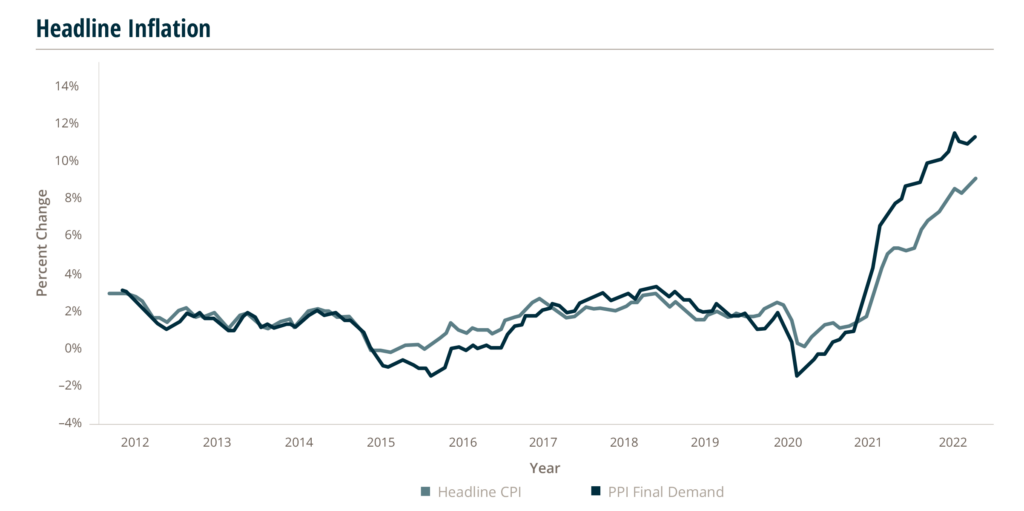
In June, the Consumer Price Index (CPI) recorded a headline increase of 9.1%, the largest recorded YoY increase in over 40 years, and above the 8.8% Dow Jones estimate. The Producer Price Index (PPI) for final demand recorded 11.3% YoY growth, short of March’s 11.6% mark, but still an increase from April and May levels as the index records its second highest level since the U.S. Bureau of Labor Statistics began publishing the final demand index.
While the CPI measures inflation for consumers based on surveys of what households are buying, the PPI measures selling prices by domestic producers of goods and services.
Over the past decade, headline PPI and CPI have remained close to each other. However, in early 2021, the two indexes began to separate as PPI began to rise faster than CPI. In December 2021, PPI was rising at a double–digit rate from the year prior and has remained above 10% for seven consecutive months. In comparison CPI, which has been rising at its fastest pace in 40 years, reached 9.1% annual growth in June.
The primary driver of growth in both indexes over the past 12 months has been rising energy prices. The second largest increases in the indexes were transportation and warehousing prices for the PPI and food prices for the CPI. Looking at core inflation, which allows a better look at long–term inflation trends by removing the most volatile parts of each index, each index saw a third straight month of declines in June, registering at 5.9% for core CPI and 6.4% for core PPI. However, for CPI, these levels have not been seen since 1982 and these are the highest core PPI numbers since the final demand index was first published. Core CPI removes food and energy costs, while core PPI removes food, energy, and trade services.
Source: U.S Bureau of Labor Statistics; CPI released 7/13/22, PPI released 7/14/22.
Can an Inverted Yield Curve Predict a Recession?
There are a lot of indicators of economic health. But few have the track record of the “yield curve inversion” for predicting recessions.
Recessions are most often declared once we are well into one, starting to emerge from it, or even after it has ended. But that doesn’t keep economists and financial journalists from trying to predict when one might be nearly upon us.
Indicators for a possible recession include negative gross domestic product growth, a high unemployment rate, rising interest rates, or if the two–year U.S. Treasury note returns higher yields than the 10–year note, also known as the yield curve inversion.
The reason a two–year note yield would exceed that of its 10–year counterpart is usually an issue of lack of investor confidence in long–term investments and their expected return due to rising inflation, rising interest rates and an expectation of a slowing economy. In short, investors become doubtful that the return on a 10–year note would be better than the return on a shorter–term note.
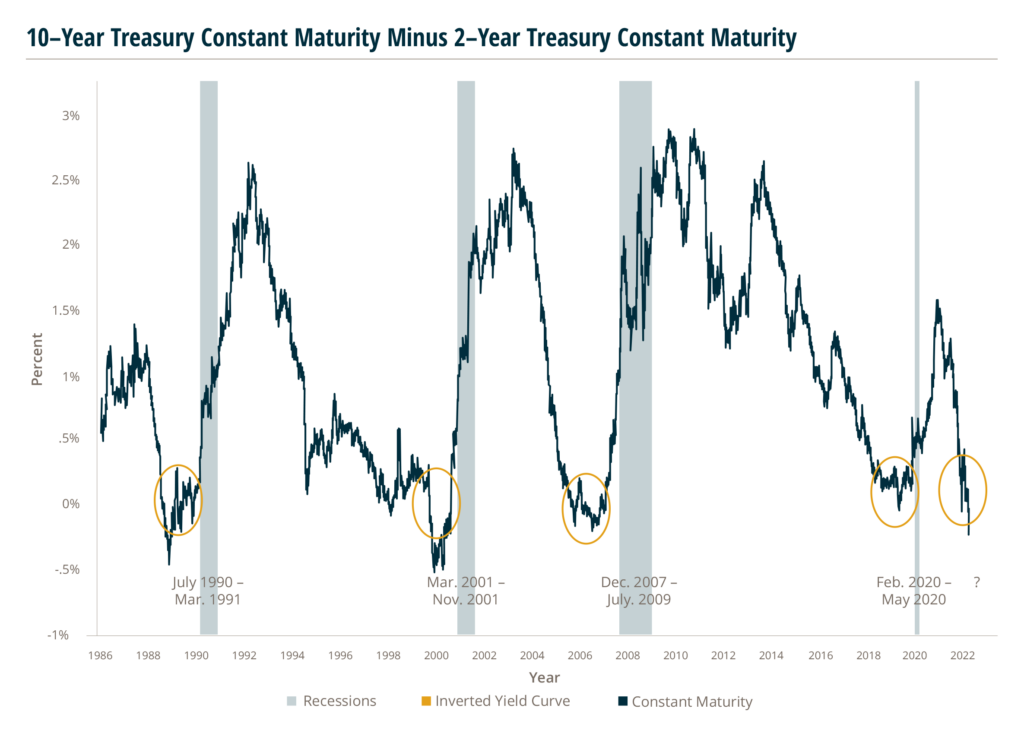
Of all recession indicators, the inverted yield curve is one of the most historically accurate. Almost every recession over the past 60 years has been preceded by an inverted yield curve. The exception is 1966, where the inverted yield curve only preceded an economic slowdown, but not an official recession. The most recent three– month recession of 2020 was preceded by a brief yield curve inversion.
Keep in mind, a yield curve inversion doesn’t cause a recession. It’s simply a reaction to other economic factors (i.e., rising inflation and increased interest rates) that make investors jittery enough to take an action (i.e., buying short–term bonds) that exhibits their feelings about investment risks.
Most recently, the yield difference between the 10– and two–year Treasury notes dropped below zero on 4/1/22, bounced back up a few days later, but dipped below zero again on 7/6/22 and continues to be inverted.
Is all of this pointing towards a recession? Maybe. How long will a recession last and what will the impact be? No one really knows. But in the meantime — insurance brokerages and carriers may want to consider doing some advanced scenario planning and assess how they will maneuver through potential volatility and macroeconomic changes.
Consumer Confidence Is Affected by Inflation, Signaling a Slowing Economy
A fear of a recession looms and market conditions worsen, consumers are feeling the impact and adjusting spending habits.
With consumer spending making up 70% of Gross Domestic Product (GDP), this has a large influence over the direction of the economy.
The University of Michigan recently released its report on Consumer Sentiment Retail Sales, providing insight to the future economic outlook.
Consumer sentiment increased to 51.1 in July after a record low of 50.0 the previous month. This contrasts with the 85.5 reading registered in July 2021. Historically, the University of Michigan Consumer Sentiment Index hit a record high of 112.0 in January 2000 and a record low of 50.0 in June of 2022.
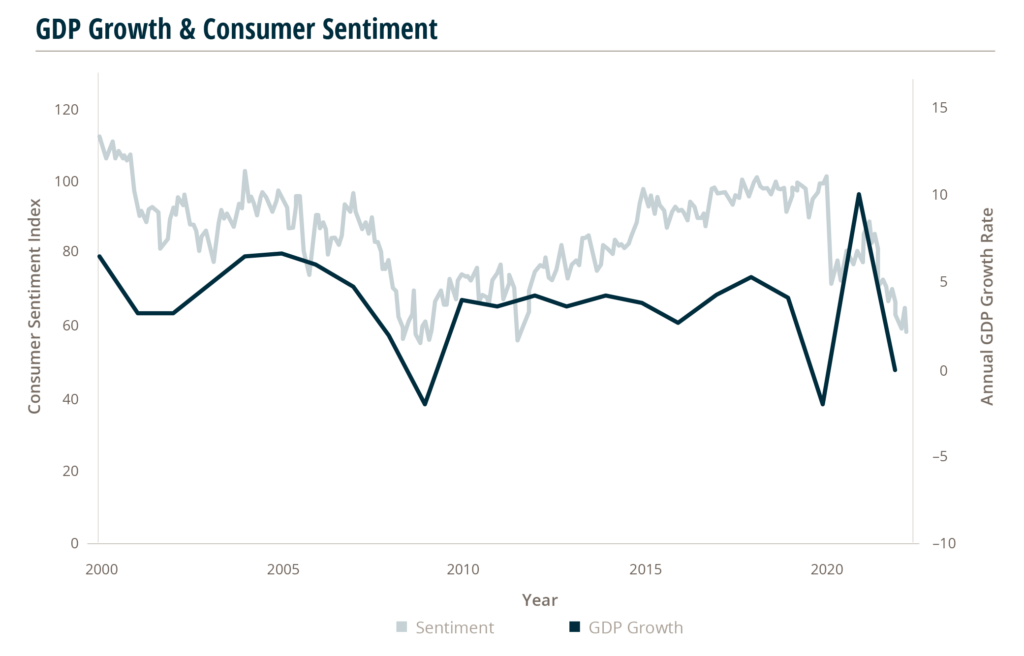
Even with the increase to consumer sentiment and economic conditions subindex increase to 57.1, up from 53.8 previously, the expectations gauge continued to decrease, falling to 47.3, hitting the lowest point since 1980. Consumers agreed on the detrimental effect of prices on personal finance with 49% blaming inflation for decreasing their living standards.
Consumers are not just feeling this effect, they are acting on it, as real retail sales declined in June.
With inflation increasing 1.3% on a monthly basis in June, the 1% increase in retail sales did not keep up. The largest contributors to the increase in sales were in food and gasoline, two areas with increased rising costs. The increased spending in these categories reflects the increase in nominal sales values, not consumer demand, resulting in slightly decreased to stagnant consumer demand as reflected by spending habits in the retail market. Even so, consumer resilience is holding strong showing as debt to after–tax income remains below long–term levels and household net worth holds steady as the stock market sees upticks.
As consumers face the burden of increased borrowing costs, rising inflation, and market downturns, their skepticism is compelling. The average real earnings of workers is down 3.6% YoY in June as wages struggle to keep up with inflation. Combine that with international political turmoil on the coattails of a global pandemic and consumers are weary.
3.3
Increase in Consumer Sentiment
Subindex for June
49%
Of Consumers Blame Inflation for Decreasing
Their Living Standards
1.3%
Increase in Monthly Inflation
The largest contributors to the increase in sales were in food and gasoline, two areas with increased rising costs.